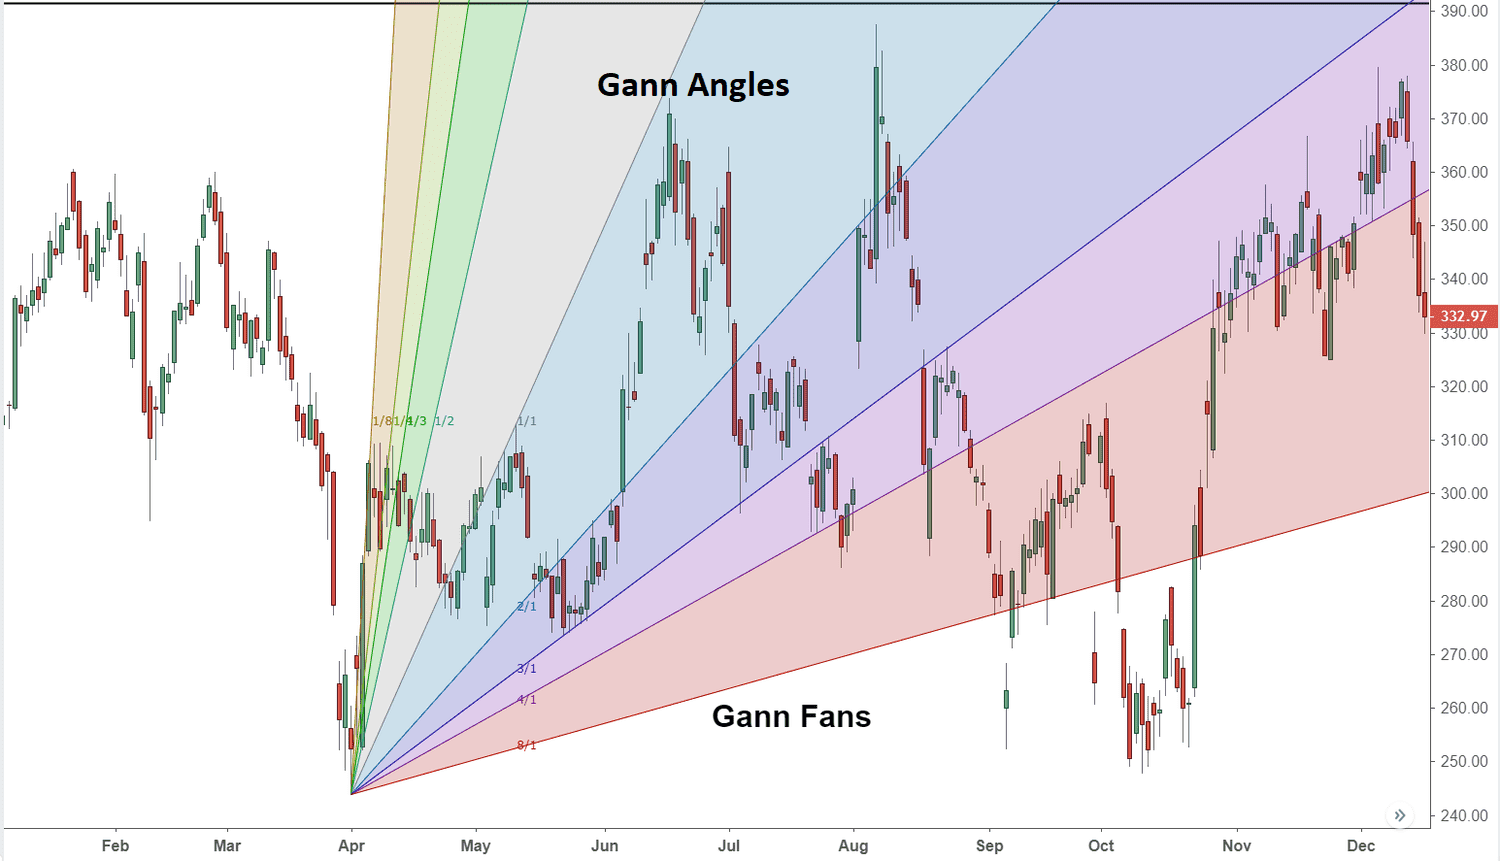
Forex trading strategies for using Gann angles: Techniques for identifying potential price levels with Gann angles.
In the world of forex trading, success is often hinged on the ability to accurately predict future price movements. Countless traders rely on various tools and techniques to gain an edge in this dynamic market. One such method that has stood the test of time is the use of Gann angles. Developed by the legendary trader W.D. Gann, Gann angles are geometric principles that offer traders a unique perspective on price movement. In this article, we will delve into the intricacies of Gann angles and explore effective forex trading strategies that harness their power for identifying potential price levels.

Table Content
I. Understanding Gann Angles
II. Identifying Potential Price Levels with Gann Angles
1. Drawing Gann Angles
2. 45-Degree Angle (1x1)
3. Support and Resistance Levels
4. Time and Price Squaring
III. Forex Trading Strategies with Gann Angles
1. Gann Fan Strategy
2. Gann Square of Nine Strategy
3. Time and Price Squaring Strategy
4. Confluence with Other Indicators
IV. Footnote
Understanding Gann Angles
William Delbert Gann, a pioneer in technical analysis, introduced Gann angles in the early 20th century. He believed that both price and time were interconnected and could be accurately predicted using specific geometric angles. Gann angles are essentially diagonal lines that are drawn on price charts to help traders identify potential support and resistance levels, as well as predict future price movements.
The key principle behind Gann angles is the concept of the 1x1 angle, which represents a 45-degree angle. Gann believed that when price moves at a 45-degree angle in relation to time, it signifies a balance between supply and demand. Other angles, such as the 2x1 (26.5 degrees), 3x1 (18.75 degrees), and 4x1 (15 degrees), are also used to identify potential price levels and trends.
Identifying Potential Price Levels with Gann Angles
1. Drawing Gann Angles
To begin using Gann angles, traders must first identify significant highs and lows on a price chart. These points serve as the anchor points for drawing Gann angles. The process involves drawing a line from a low to a subsequent high (for an uptrend) or from a high to a subsequent low (for a downtrend). The angle of the line depends on the chosen Gann angle ratio, such as 1x1, 2x1, and so on.
2. 45-Degree Angle (1x1)
The 1x1 Gann angle is considered the most important, as it signifies a balanced market. When price moves along this angle, it indicates that price and time are progressing harmoniously. A break above the 1x1 angle suggests a strong uptrend, while a break below indicates a strong downtrend. Traders often look for confluence between the 1x1 angle and other technical indicators to validate potential trading opportunities.
3. Support and Resistance Levels
Gann angles also help traders identify potential support and resistance levels. When price intersects a Gann angle, it can act as a significant support or resistance level. For example, if an uptrend price crosses above a 2x1 Gann angle, that angle becomes a potential support level. Conversely, if a downtrend price crosses below a 2x1 angle, it can act as a resistance level.
4. Time and Price Squaring
Gann's principles go beyond just price angles. He also emphasized the importance of time in his analysis. By using Gann squares, traders can identify potential reversal points by aligning specific time and price intervals. A Gann square is formed by creating a square grid on a price chart, with each box representing a specific time and price unit. When price and time align with a diagonal or horizontal line on the grid, it can signal potential turning points.
Forex Trading Strategies with Gann Angles
1. Gann Fan Strategy
The Gann Fan strategy involves drawing multiple Gann angles on a price chart to identify potential trends, support, and resistance levels. Traders look for intersections between price and Gann angles, using these points as potential entry or exit signals. For instance, if price bounces off a Gann angle during an uptrend, it could signal a buying opportunity.
2. Gann Square of Nine Strategy
The Gann Square of Nine strategy is based on the concept of squaring both time and price. Traders construct a square grid with numbers arranged in a spiral pattern. Each number represents a specific price or time level. By analyzing the interactions between price and time within the square, traders can identify potential reversal points or areas of congestion.
3. Time and Price Squaring Strategy
This strategy involves identifying significant highs and lows on a price chart and aligning them with specific time intervals. By using Gann's time and price squaring principles, traders can anticipate potential trend changes or price reversals. This strategy is particularly useful for long-term traders looking to capture major price movements.
4. Confluence with Other Indicators
While Gann angles can be powerful on their own, they are often more effective when combined with other technical indicators. Traders commonly use Gann angles in conjunction with trendlines, moving averages, and Fibonacci retracement levels to validate potential trading signals. When multiple indicators confirm a potential price level or trend, it increases the likelihood of a successful trade.
Footnote
Gann angles remain a valuable tool in the arsenal of forex traders seeking to forecast price movements and identify potential trading opportunities. These geometric principles offer a unique perspective on market dynamics, enabling traders to visualize trends, support and resistance levels, and potential reversal points. By mastering the art of drawing and interpreting Gann angles, traders can enhance their decision-making process and improve their overall trading success. However, like any trading strategy, Gann angles should be used in conjunction with proper risk management and a thorough understanding of the market conditions. As the forex market continues to evolve, Gann's principles provide a timeless foundation for traders to navigate the complexities of price action.


Discussion