
Forex trading strategies for using candlestick patterns: Approaches for recognizing and trading candlestick patterns.
In the world of forex trading, where rapid decision-making is paramount, utilizing candlestick patterns can provide traders with valuable insights into market trends and potential price movements. These patterns have been utilized for centuries and are renowned for their ability to enhance trading strategies by aiding in the prediction of price shifts and reversals. In this article, we will delve into the various approaches for recognizing and effectively trading candlestick patterns in the forex market.
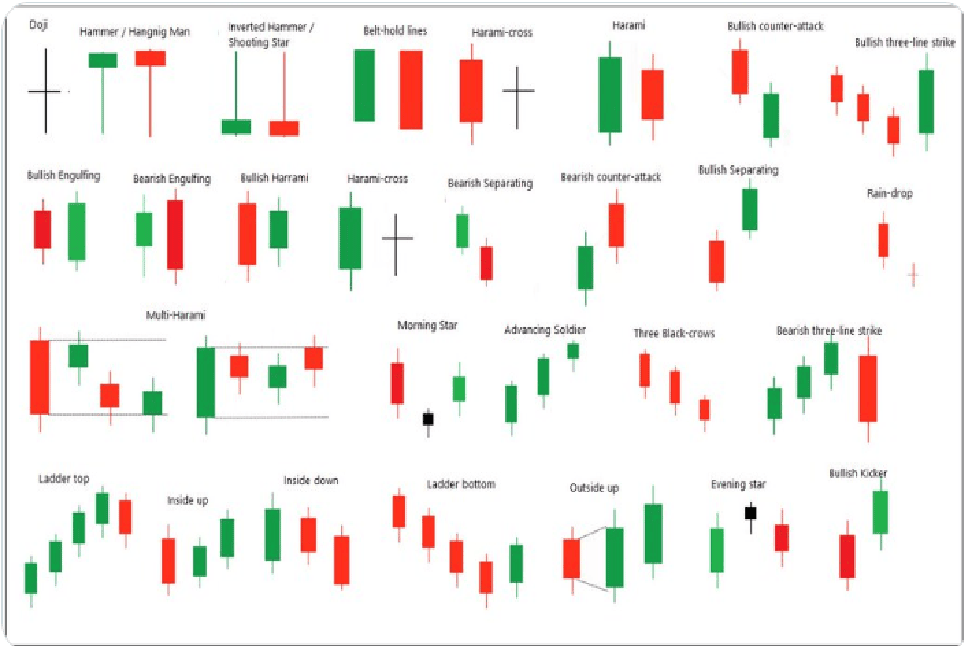
Table Content
I. The Art of Candlestick Patterns
II. Recognizing Candlestick Patterns
1. Doji
2. Hammer and Hanging Man
3. Bullish and Bearish Engulfing
4. Morning and Evening Star
5. Piercing Pattern and Dark Cloud Cover
III. Strategies for Trading Candlestick Patterns
1. Confirmation through Technical Indicators
2. Support and Resistance Levels
3. Multiple Timeframe Analysis
4. Risk Management
5. Practice and Back-testing
IV. Footnote
The Art of Candlestick Patterns
Candlestick patterns originated in 17th century Japan and were used to analyze the price movements of rice contracts. They have since evolved to become an integral part of technical analysis across various financial markets, including forex. Each candlestick on a price chart represents the price movement of a specific time period, whether that's a minute, an hour, a day, or any other chosen timeframe.
Candlestick patterns are formed by the combination of one or more candlesticks on a chart. They provide valuable information about the psychology of market participants and the balance between buyers and sellers. These patterns are categorized into two main types: reversal patterns and continuation patterns. Reversal patterns indicate potential trend reversals, while continuation patterns suggest that the prevailing trend will likely continue.
Recognizing Candlestick Patterns
To effectively utilize candlestick patterns in forex trading, it is essential to recognize and understand the most common and reliable patterns. Some of the key patterns include:
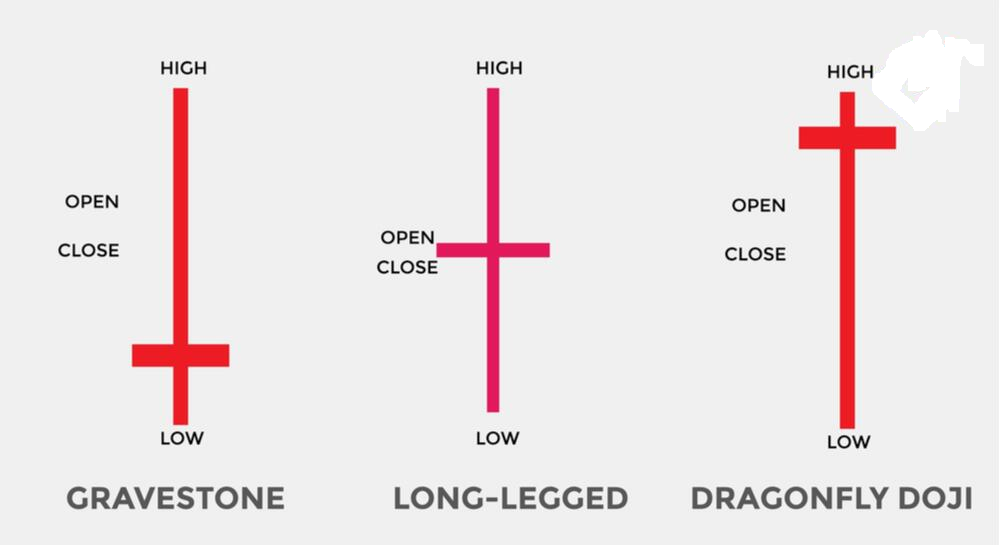
1. Doji
The Doji is a single candlestick pattern that signifies market indecision. It occurs when the opening and closing prices are nearly the same, resulting in a small or nonexistent body. Traders often interpret Doji patterns as potential trend reversals, especially when they appear after a prolonged uptrend or downtrend.
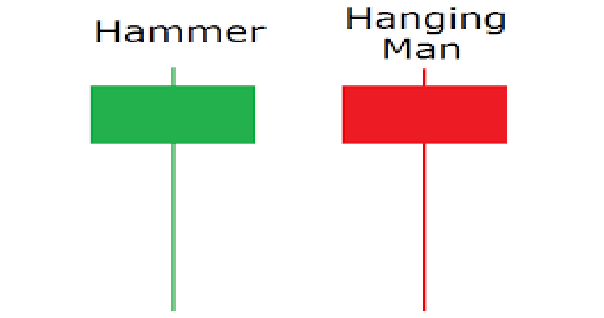
2. Hammer and Hanging Man
These patterns are characterized by a small body and a long lower shadow. The Hammer appears after a downtrend and suggests a potential bullish reversal, while the Hanging Man appears after an uptrend and hints at a bearish reversal.
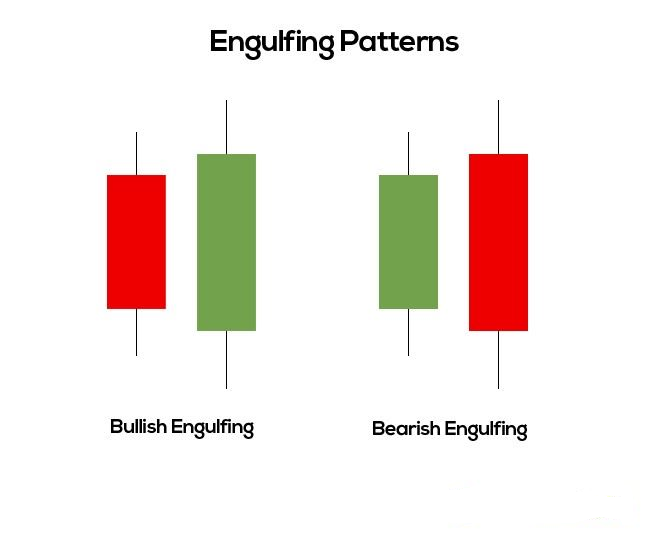
3. Bullish and Bearish Engulfing
The Bullish Engulfing pattern occurs when a small bearish candle is followed by a larger bullish candle that engulfs it. This suggests a potential reversal from a downtrend to an uptrend. Conversely, the Bearish Engulfing pattern signals a potential reversal from an uptrend to a downtrend.
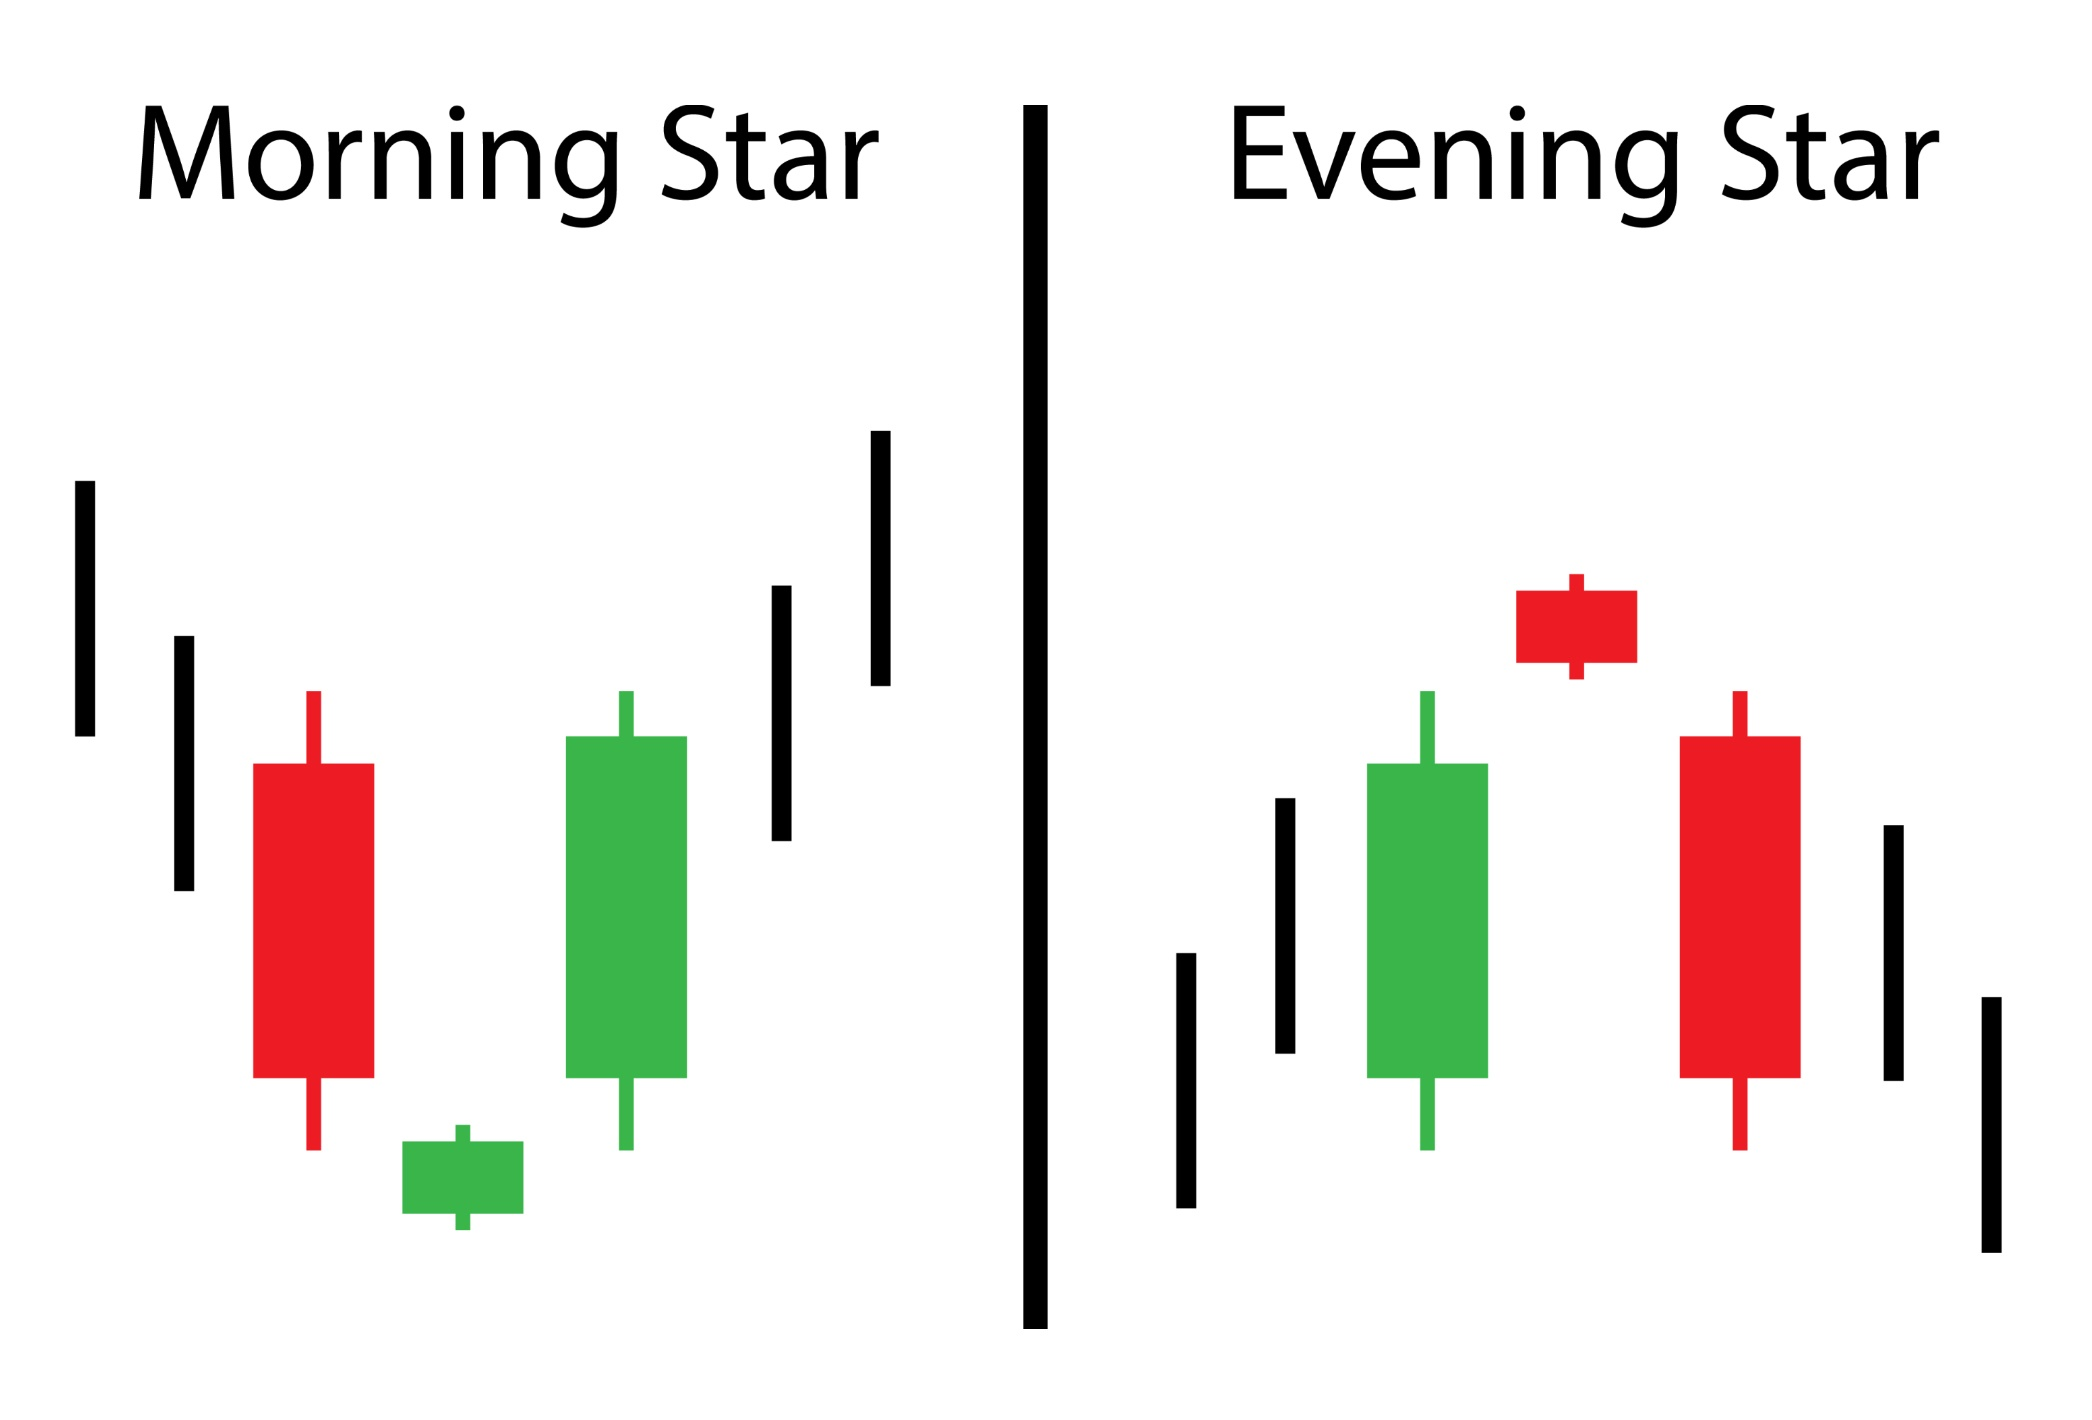
4. Morning and Evening Star
The Morning Star pattern consists of a bearish candle, followed by a small candle (Doji or spinning top), and then a bullish candle. This pattern indicates a potential bullish reversal. Conversely, the Evening Star pattern occurs after an uptrend and suggests a potential bearish reversal.
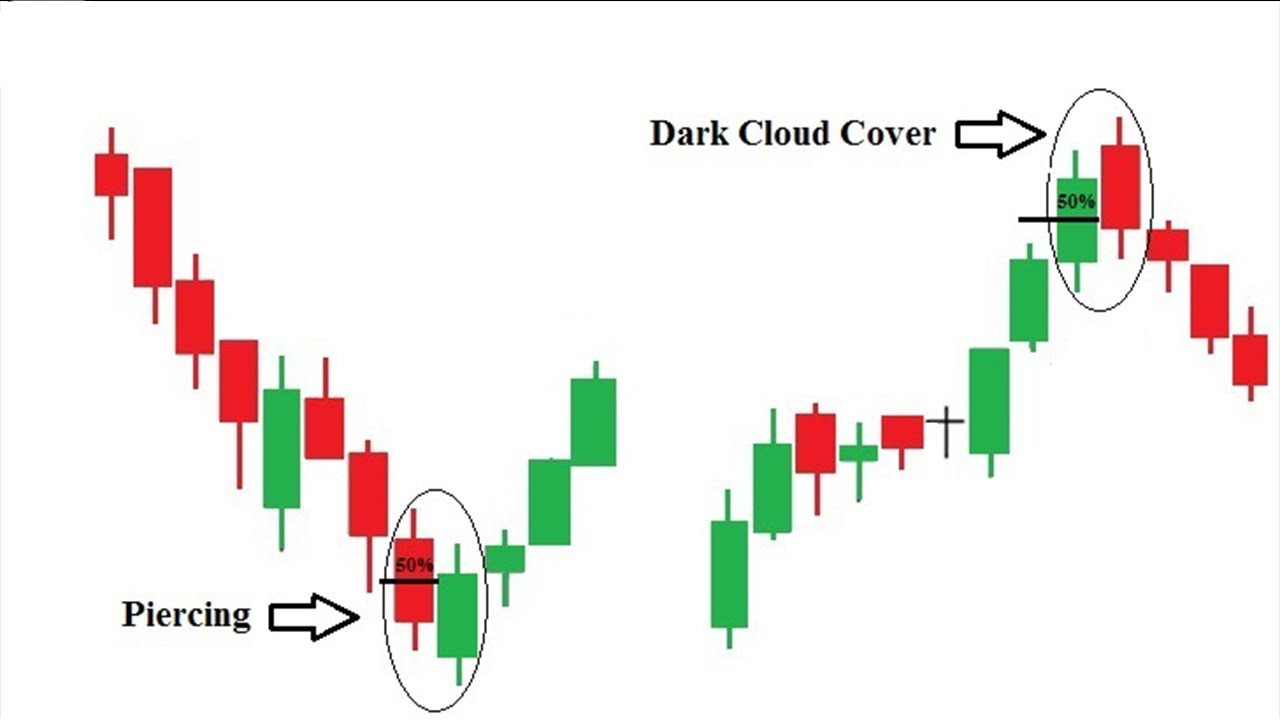
5. Piercing Pattern and Dark Cloud Cover
The Piercing Pattern is a two-candle bullish reversal pattern where a bullish candle follows a bearish candle and closes above its midpoint. The Dark Cloud Cover is its bearish counterpart, occurring after an uptrend and suggesting a potential reversal.
Strategies for Trading Candlestick Patterns
Recognizing candlestick patterns is just the first step; effective trading strategies involve understanding how to integrate these patterns into your trading decisions.
1. Confirmation through Technical Indicators
Candlestick patterns can be further validated by using technical indicators. For instance, if a Bullish Engulfing pattern is identified, traders can look for confirmation through indicators like the Moving Average Convergence Divergence (MACD) or the Relative Strength Index (RSI). If these indicators also indicate a potential reversal, it strengthens the likelihood of a successful trade.
2. Support and Resistance Levels
Incorporating support and resistance levels into your candlestick pattern analysis can enhance the accuracy of your trades. If a reversal pattern forms near a significant support level, it can provide a more compelling trade opportunity. Similarly, if a continuation pattern appears near a resistance level, it could indicate a potential breakout.
3. Multiple Timeframe Analysis
Analyzing candlestick patterns across multiple timeframes can provide a broader perspective on market trends. For instance, if a bullish reversal pattern forms on both the daily and weekly charts, it indicates a stronger potential reversal. This approach helps filter out noise and false signals that can occur on shorter timeframes.
4. Risk Management
No trading strategy is complete without proper risk management. Set stop-loss orders to limit potential losses if the trade goes against you. Additionally, calculate your position size based on your risk tolerance and the distance between your entry point and stop-loss level.
5. Practice and Back-testing
Before implementing any candlestick pattern strategy in live trading, practice and back-test your strategy on historical price data. This allows you to fine-tune your approach, understand the nuances of different patterns, and build confidence in your trading decisions.
Footnote
Candlestick patterns provide traders with a visual representation of market sentiment and trends, making them a valuable tool for forex trading. By mastering the art of recognizing and effectively trading these patterns, traders can gain an edge in the volatile forex market. However, it's important to remember that no strategy guarantees success. Markets can be unpredictable, and risk is inherent in trading. Therefore, it's crucial to combine candlestick pattern analysis with comprehensive risk management techniques and a well-defined trading plan.
Whether you're a novice trader or an experienced one, incorporating candlestick patterns into your trading arsenal can enhance your decision-making process and improve your overall trading performance. As you gain more experience and refine your skills, you'll find that candlestick patterns are not only informative but also fascinating windows into the psychology of the market.


Discussion