Forex Trading Strategies for Trading on Chart Patterns: Techniques for Recognizing and Trading Chart Patterns
In the world of forex trading, chart patterns are powerful tools that traders use to analyze price movements and make informed trading decisions. These patterns emerge due to the psychological dynamics of the market, reflecting the ongoing battle between buyers and sellers. Being able to recognize and interpret chart patterns can provide traders with valuable insights into potential market trends and reversals. In this article, we will delve into various forex trading strategies that revolve around recognizing and effectively trading on chart patterns.
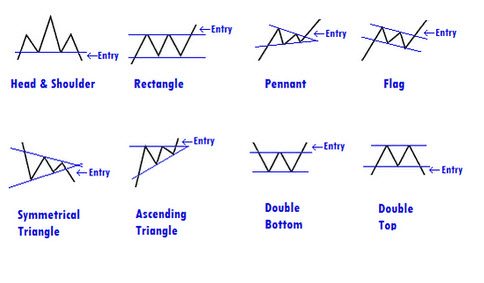
Table Content
1. Understanding Chart Patterns
i) Continuation Patterns
ii) Reversal Patterns
2. Trading Strategies for Chart Patterns
a) Breakout Strategy
b) Pullback Strategy
c) Pattern Completion Strategy
d) Confirmation from Indicators
e) Risk Management and Position Sizing
3. Footnote
Understanding Chart Patterns
Chart patterns are visual representations of price movements on a forex chart. They form as a result of repetitive market behaviors driven by traders' sentiments and emotions. Chart patterns can be broadly categorized into two types: continuation patterns and reversal patterns.
I. Continuation Patterns: Continuation patterns suggest that the prevailing trend is likely to continue after a brief consolidation period. Some common continuation patterns include:
a) Flag Pattern: A small rectangular-shaped pattern that forms after a sharp price movement. It indicates a temporary pause in the trend before the price continues in the same direction.
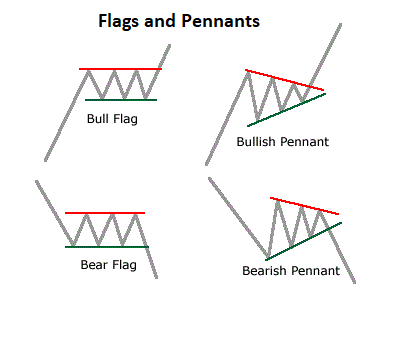
b) Pennant Pattern: Similar to the flag pattern, but with converging trendlines. It signals a short-term consolidation before the trend resumes.
c) Symmetrical Triangle: A pattern characterized by two converging trendlines. It suggests indecision in the market before the price breaks out in either direction.
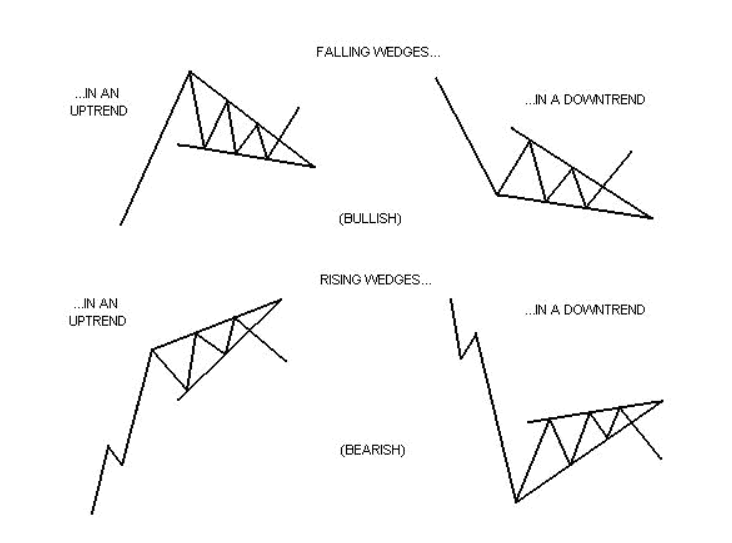
II. Reversal Patterns: Reversal patterns indicate that the current trend is likely to reverse, offering traders an opportunity to enter the market in the opposite direction. Some common reversal patterns include:
i) Head and Shoulders: A pattern with three peaks: a higher peak (head) between two lower peaks (shoulders). It suggests a shift from an uptrend to a downtrend.
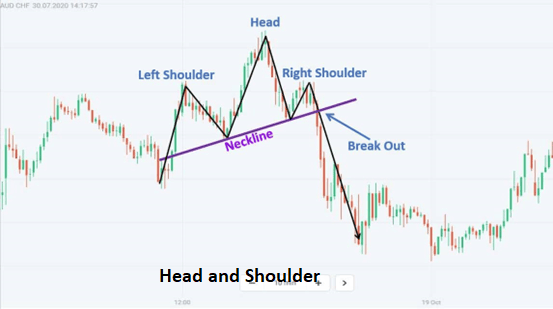
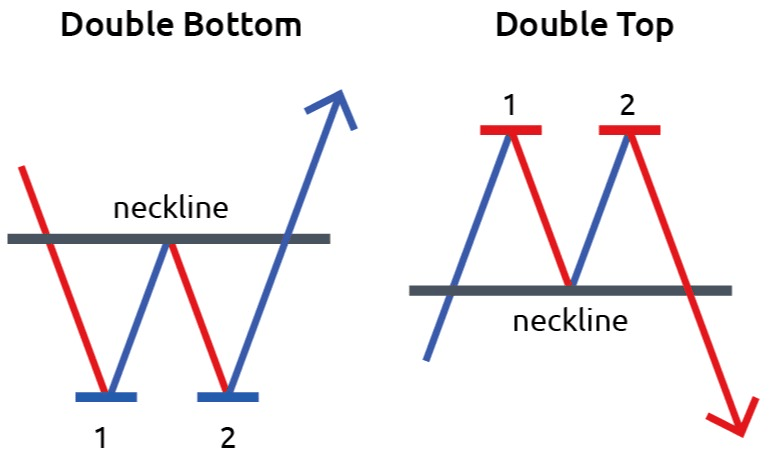
ii) Double Top/Bottom: A pattern with two distinct peaks (top) or troughs (bottom) at roughly the same price level. It signifies a potential reversal of the prevailing trend.
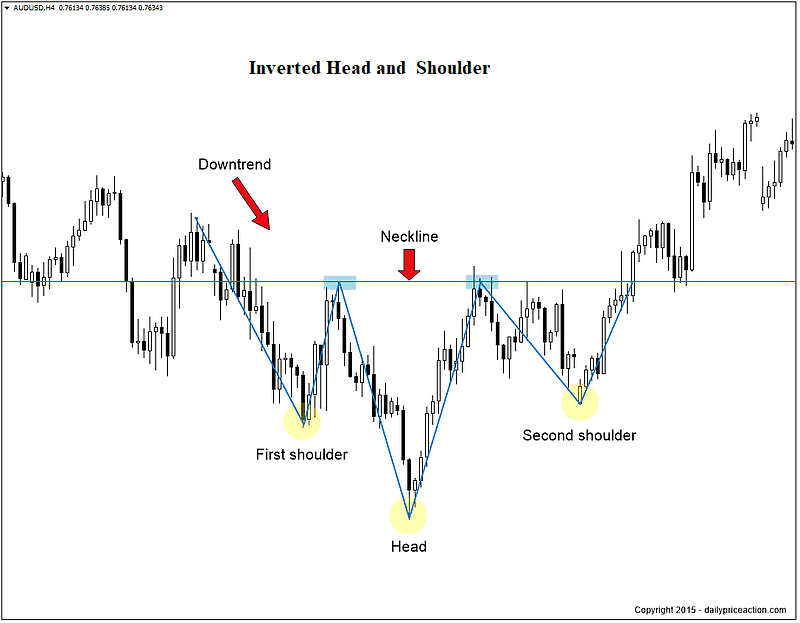
iii) Inverted Head and Shoulders: The opposite of the head and shoulders pattern. It indicates a transition from a downtrend to an uptrend.
Trading Strategies for Chart Patterns
- Breakout Strategy: The breakout strategy involves waiting for the price to break through a specific level of support or resistance within a chart pattern. Traders can enter the market when the price moves beyond this level, indicating a potential continuation or reversal of the trend. This strategy requires patience and careful monitoring of price movements.
- Pullback Strategy: The pullback strategy capitalizes on the temporary retracement that often occurs after a breakout. Traders wait for the price to pull back to the breakout level before entering the market in the direction of the original breakout. This approach can offer favorable risk-reward ratios as traders enter at a better price after the initial breakout.
- Pattern Completion Strategy: This strategy involves waiting for the complete formation of a chart pattern before entering a trade. For example, in the case of a head and shoulders pattern, a trader would wait for all three peaks to form before taking action. While this strategy may lead to slightly delayed entries, it provides confirmation that the pattern is indeed in place.
- Confirmation from Indicators: Combining chart patterns with technical indicators can enhance the accuracy of trading decisions. Indicators such as Moving Averages, Relative Strength Index (RSI), and MACD can provide additional insights into the strength of a trend or potential reversals. For instance, if a reversal pattern is forming at a key support level and the RSI indicates oversold conditions, it can provide more conviction to traders.
- Risk Management and Position Sizing: Regardless of the strategy used, effective risk management is crucial in forex trading. Traders should determine their risk tolerance and set stop-loss orders to limit potential losses. Position sizing should also be carefully considered to ensure that a single trade does not overly impact the trader's overall portfolio.
Footnote
Forex trading is a dynamic endeavor that requires a deep understanding of market trends and behaviors. Chart patterns serve as valuable tools in a trader's toolkit, offering insights into potential price movements and trends. By recognizing and effectively trading on chart patterns, traders can increase their chances of making informed decisions and achieving consistent profitability. It's important to remember that no trading strategy guarantees success, and continuous learning, practice, and adaptation are key to becoming a successful forex trader.


Discussion