

Forex Trading Strategies for Identifying Trends: Techniques for Recognizing Prevailing Market Directions
The foreign exchange market, or forex, is one of the most dynamic and liquid markets in the world, where currencies are traded around the clock. Traders and investors are constantly seeking ways to gain an edge in this fast-paced environment. One of the key skills in successful forex trading is the ability to identify and follow trends in the market. A trend is a general direction in which the market is moving, and recognizing these trends can be highly profitable for traders. In this article, we will delve into various forex trading strategies for identifying trends and techniques that traders can use to spot prevailing market directions.
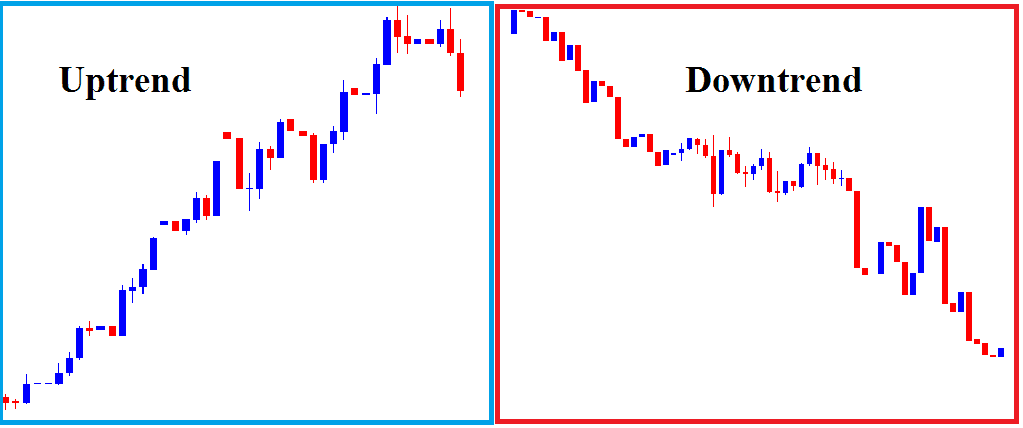
Table Content
1. Understanding Trends in Forex Trading
2. Moving Averages: The Foundation of Trend Identification
3. Trendlines and Channels: Visualizing Trend Direction
4. Relative Strength Index (RSI): Gauging Overbought and Oversold Conditions
5. Moving Average Convergence Divergence (MACD): A Comprehensive Trend Indicator
6. Ichimoku Cloud: A Holistic Trend Analysis Tool
7. Fundamental Analysis: A Macroscopic Perspective
8. Footnote
Understanding Trends in Forex Trading
A trend in forex trading refers to the overall direction in which a currency pair's price is moving. These trends can be broadly categorized into three main types: uptrends, downtrends, and sideways trends (also known as ranges). Uptrends occur when the price of a currency pair is consistently making higher highs and higher lows. Conversely, downtrends occur when the price is making lower lows and lower highs. Sideways trends occur when the price moves within a relatively narrow range without making significant upward or downward movements.
Identifying trends is crucial because trading in the direction of the prevailing trend can increase the probability of a trade's success. However, accurately recognizing trends requires more than just looking at price charts. It involves employing a combination of technical analysis tools, indicators, and strategies.
1. Moving Averages: The Foundation of Trend Identification
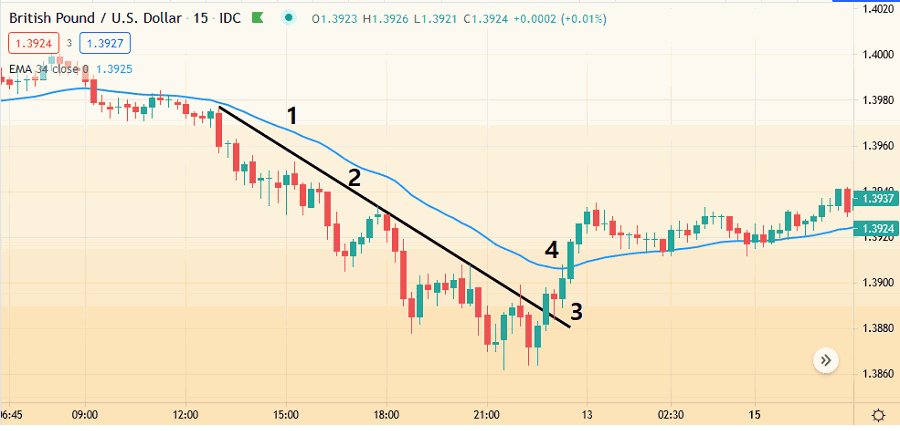
Moving averages are one of the most fundamental tools used by forex traders to identify trends. A moving average is a calculated average of a currency pair's price over a specific period. It smooths out short-term price fluctuations and provides traders with a clearer view of the underlying trend. The two most commonly used moving averages are the simple moving average (SMA) and the exponential moving average (EMA).
Traders often use crossovers between different moving averages to identify trends. For example, when a short-term moving average crosses above a long-term moving average, it is often considered a signal for an uptrend. Conversely, a short-term moving average crossing below a long-term moving average may signal a potential downtrend.
2. Trendlines and Channels: Visualizing Trend Direction
Trendlines and channels are visual tools that traders use to identify and confirm trends. A trendline is drawn by connecting the lows or highs of a currency pair's price movements. An uptrend is confirmed when a trendline connecting the lows is sloping upwards, while a downtrend is confirmed with a downward-sloping trendline connecting the highs.
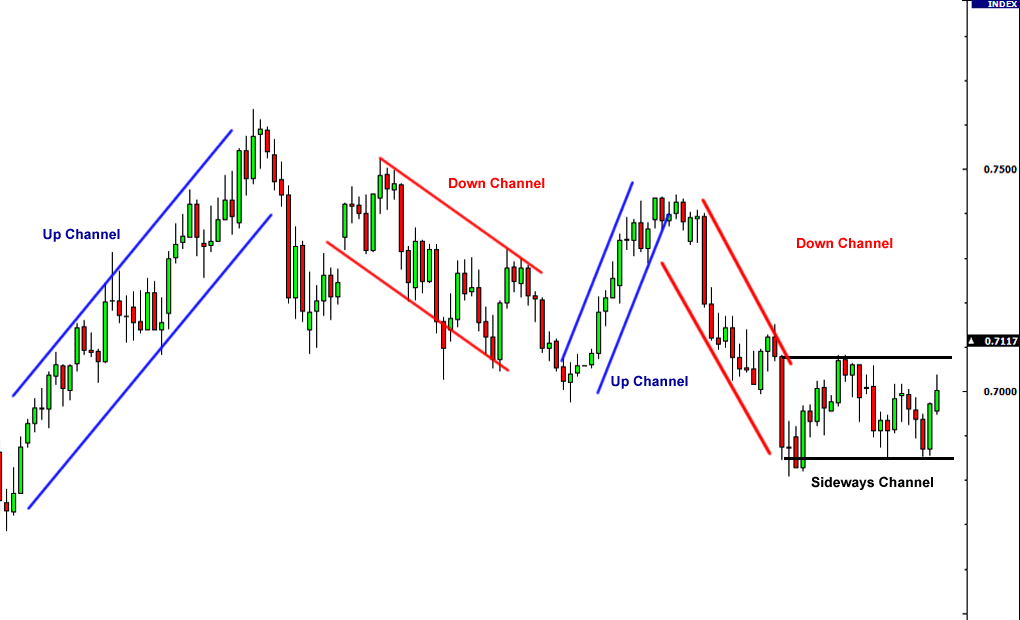
Channels are formed by drawing parallel trendlines above and below the price movements. An uptrend channel consists of an ascending trendline and a parallel line above it. A downtrend channel has a descending trendline and a parallel line below. Trading within these channels can provide valuable insights into potential entry and exit points.
3. Relative Strength Index (RSI): Gauging Overbought and Oversold Conditions
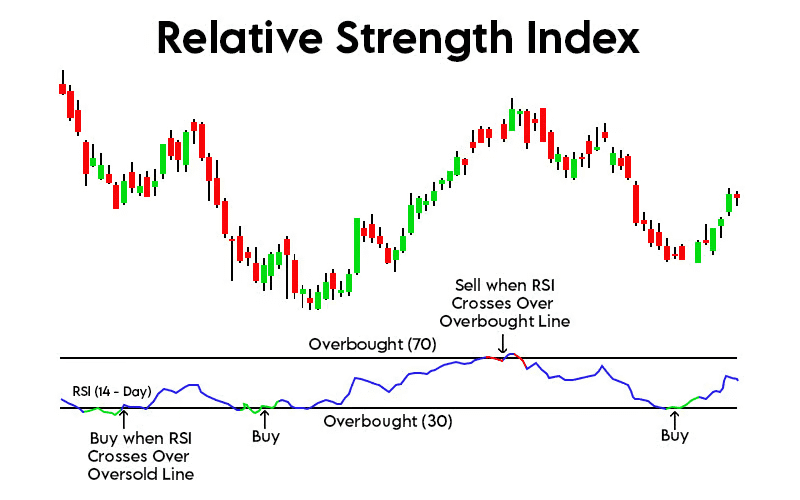
The Relative Strength Index (RSI) is a momentum oscillator that measures the speed and change of price movements. It ranges from 0 to 100 and is used to identify overbought and oversold conditions in the market. In an uptrend, the RSI can remain in the overbought zone (typically above 70) for an extended period as the price continues to rise. Conversely, in a downtrend, the RSI can stay in the oversold zone (usually below 30) as the price continues to decline.
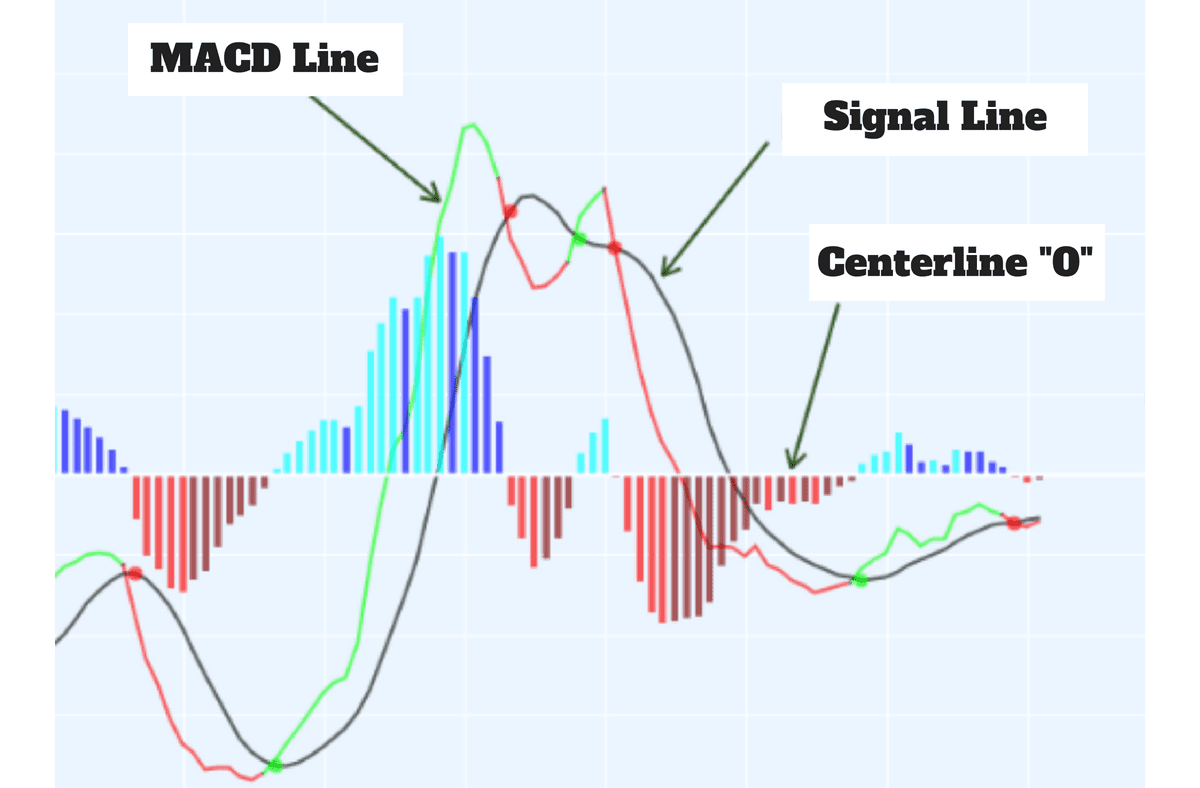
4. Moving Average Convergence Divergence (MACD): A Comprehensive Trend Indicator
The Moving Average Convergence Divergence (MACD) is a versatile indicator that combines moving averages and momentum analysis. It consists of two moving averages (a faster one and a slower one) and a histogram that represents the difference between the two. Traders look for crossovers between the MACD line and its signal line as well as changes in the histogram to identify potential trend shifts.
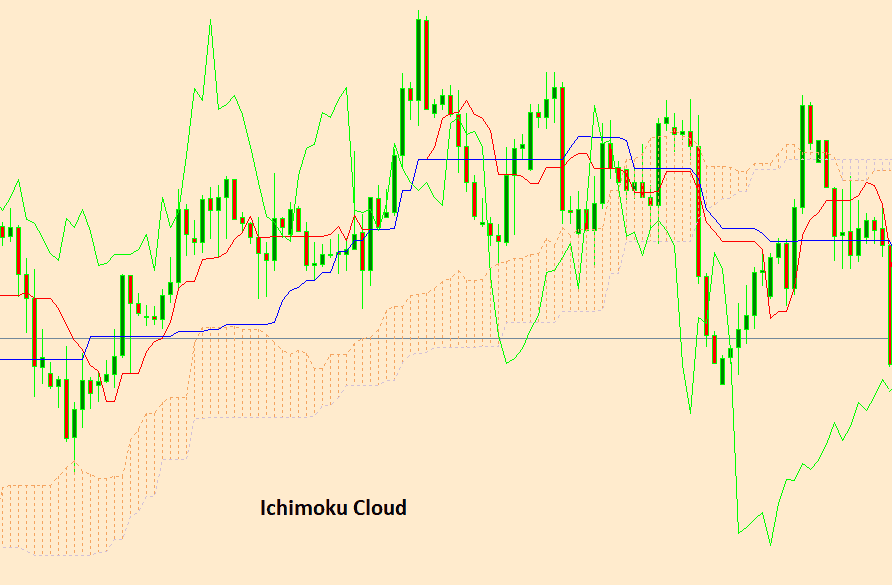
5. Ichimoku Cloud: A Holistic Trend Analysis Tool
The Ichimoku Cloud, also known as Ichimoku Kinko Hyo, is a comprehensive indicator that provides a holistic view of trend direction, support and resistance levels, and momentum. It consists of five lines: Tenkan-sen (Conversion Line), Kijun-sen (Base Line), Senkou Span A (Leading Span A), Senkou Span B (Leading Span B), and Chikou Span (Lagging Span). When these lines are used together, they create a "cloud" that helps traders identify trends, reversals, and potential entry and exit points.
6. Fundamental Analysis: A Macroscopic Perspective
While technical analysis tools are essential for identifying trends, traders should not neglect the impact of fundamental factors on currency prices. Economic indicators, central bank policies, geopolitical events, and news releases can all influence the prevailing trend in the forex market. Combining technical and fundamental analysis can provide a more well-rounded view of market directions.
Footnote
Identifying trends is a critical skill for forex traders looking to maximize their profits and minimize their risks. While no strategy is foolproof, the combination of technical analysis tools, indicators, and fundamental insights can significantly enhance a trader's ability to recognize prevailing market directions. Whether using moving averages, trendlines, oscillators, or comprehensive indicators like the MACD and Ichimoku Cloud, traders should strive to understand the strengths and limitations of each tool and tailor their strategies to their trading style and risk tolerance.
Moreover, staying informed about global economic and geopolitical events is crucial for a comprehensive understanding of market trends. By continuously honing their trend identification skills, traders can increase their chances of success in the dynamic world of forex trading.


Discussion