

Forex Trading Strategies for Identifying Support and Resistance: Approaches for Spotting Crucial Price Levels
In the fast-paced world of forex trading, understanding the dynamics of support and resistance is essential for making informed trading decisions. These crucial price levels play a significant role in chart analysis and can greatly impact a trader's success. In this article, we'll delve into various forex trading strategies for identifying support and resistance levels, empowering traders to navigate the market with confidence.
Understanding Support and Resistance: Foundations of Technical Analysis
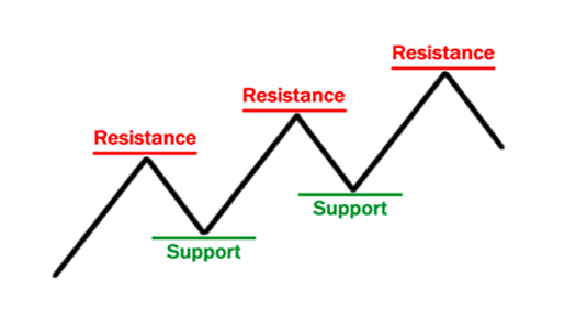
Support and resistance levels are foundational concepts in technical analysis. Support refers to a price level at which a currency pair tends to stop falling and might even experience a reversal. Resistance, on the other hand, represents a price level where a currency pair tends to stop rising and could reverse its upward movement. These levels are like psychological barriers formed due to market behavior, supply and demand dynamics, and other factors.
Common Approaches to Identifying Support and Resistance Levels
a) Horizontal Price Levels: These are the most basic support and resistance levels. Traders look for areas where the price has historically reversed or paused, forming a horizontal line on the chart. The more times a price level has acted as support or resistance, the stronger it's considered.
b) Trendlines: Trendlines are drawn along the trend direction, connecting consecutive highs or lows. When a trendline acts as support or resistance, it provides valuable insights into potential price reversals.
c) Fibonacci Retracements: Fibonacci levels are drawn based on a sequence of numbers that have significance in nature and markets. These levels, such as 38.2%, 50%, and 61.8%, indicate potential support and resistance zones.
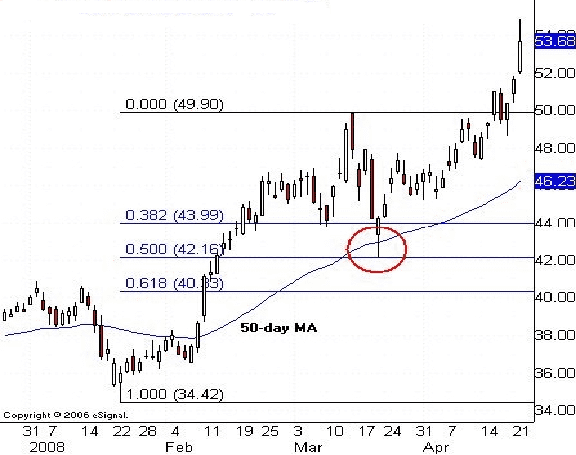
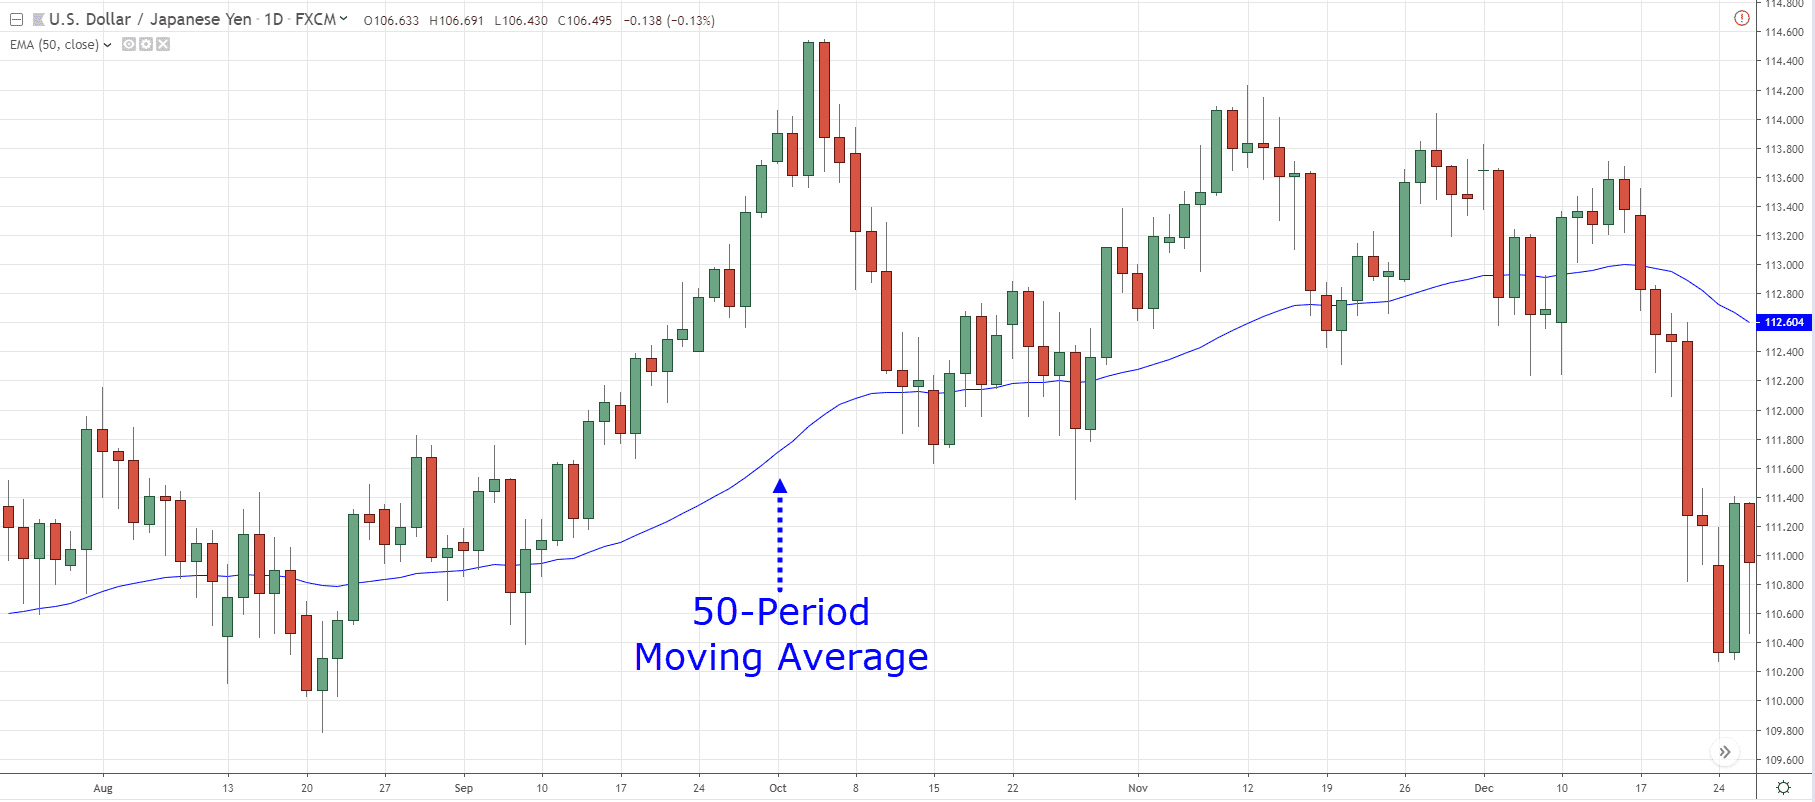
d) Moving Averages: Moving averages are smoothed lines that follow the price trend over a specific period. The 200-day moving average, for example, often acts as a long-term support or resistance level.
e) Pivot Points: Pivot points are calculated based on the previous day's high, low, and close prices. These levels help traders identify potential turning points for the current trading day.
Forex Trading Strategies for Utilizing Support and Resistance Levels
i) Break and Retest Strategy: When a support level is breached, it can turn into a resistance level. Conversely, a resistance level that's broken can become a support level. Traders using this strategy wait for the price to break a significant level, then retest it before entering a trade in the direction of the breakout.
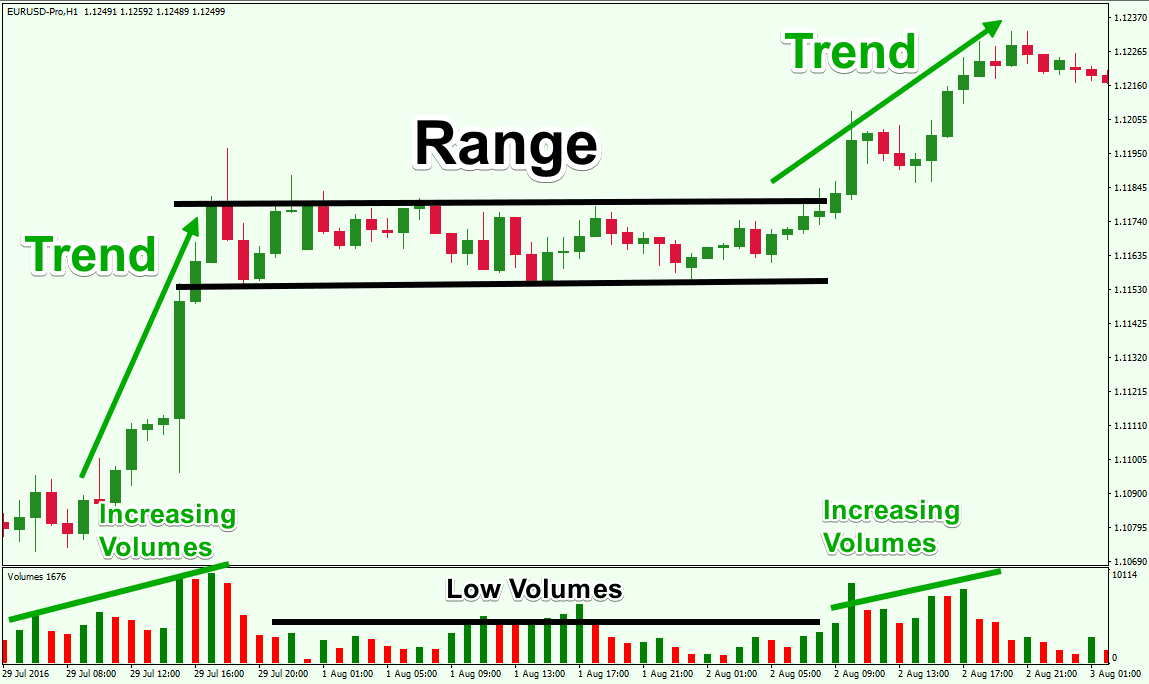
ii) Range Trading: In a ranging market, where prices move within a horizontal channel, traders can buy near support and sell near resistance. This strategy aims to profit from the price bouncing between established levels.
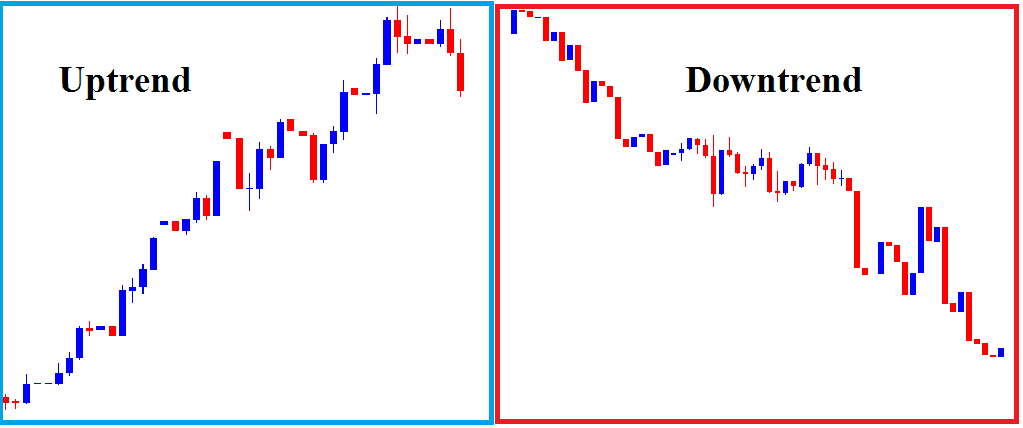
iii) Trend Following with Support and Resistance: Traders can use support and resistance levels to confirm trends. In an uptrend, buying near support can offer favorable risk-reward ratios, while selling near resistance in a downtrend can be advantageous.
iv) Bounce and Break Strategy: When price approaches a support or resistance level, traders can anticipate either a bounce or a breakout. Depending on the market conditions and other indicators, traders can take advantage of these potential moves.
v) Multiple Timeframe Analysis: Combining support and resistance analysis across different timeframes can provide a comprehensive view of the market. A level that acts as strong resistance on a daily chart might be a minor support on a lower timeframe.
FAQs About Support and Resistance in Forex Trading
Q1: Are support and resistance levels fixed or dynamic?
A: Support and resistance levels can be both fixed and dynamic. Fixed levels are based on historical price action, while dynamic levels change over time, often represented by moving averages or trendlines.
Q2: How do I confirm the strength of a support or resistance level?
A: The strength of a level is determined by how many times the price has reacted to it. The more times a level has been respected, the stronger it becomes. Additionally, factors like volume and price behavior around the level contribute to its strength.
Q3: Can support become resistance, and vice versa?
A: Yes, support levels can turn into resistance levels once they are broken, and resistance levels can become support after being breached. This phenomenon is known as "role reversal."
Q4: Should I always wait for a complete retest before entering a trade based on support or resistance? A: While waiting for a retest can provide added confirmation, it's not always necessary. Traders often use a combination of factors, such as candlestick patterns and momentum indicators, to make trading decisions.
Q5: How do news events affect support and resistance levels?
A: News events can lead to rapid price movements that breach support or resistance levels. Traders should be cautious during volatile periods and consider using wider stop-loss levels.
Q6: Can support and resistance levels work in conjunction with other technical indicators?
A: Absolutely. Support and resistance levels can be used alongside indicators like moving averages, MACD, RSI, and others to validate trading signals and increase the likelihood of accurate predictions.
Q7: Do support and resistance levels have expiration dates?
A: Support and resistance levels don't have fixed expiration dates. However, their relevance can diminish over time due to changing market dynamics. Traders should regularly reassess their charts and adjust their strategies accordingly.
Footnote
Mastering the art of identifying support and resistance levels is an essential skill for forex traders. These levels provide valuable insights into potential price reversals, breakouts, and trend confirmations. By combining various strategies and techniques, traders can enhance their ability to accurately spot crucial price levels, thus making informed trading decisions in the dynamic world of forex. Remember that while support and resistance levels are powerful tools, they should be used in conjunction with other analysis methods to create a comprehensive trading strategy.


Discussion