

Forex Technical Analysis: Analyzing Historical Market Data to Forecast Future Price Movements
In the fast-paced world of Forex trading, staying ahead of the game requires a deep understanding of market trends and potential price movements. One valuable tool that traders use to gain insights into the future direction of currency pairs is Forex technical analysis. By examining historical market data and chart patterns, investors can identify potential opportunities and make informed trading decisions. In this article, we will delve into the art of Forex technical analysis and how it can be a powerful weapon in a trader's arsenal.
Table Content
1. Understanding Technical Analysis
2. The Foundation: Price Charts
3. Key Concepts in Technical Analysis
4. Technical Indicators
5. How to Use Technical Analysis in Forex Trading
6. The Limitations of Technical Analysis
7. Footnote
Understanding Technical Analysis
Forex technical analysis is the practice of studying past market data, primarily price and volume, to forecast future price movements. Unlike fundamental analysis, which focuses on economic indicators and news events, technical analysis relies on historical data patterns to make predictions.
The Foundation: Price Charts
Price charts are the backbone of technical analysis. They provide a visual representation of a currency pair's historical price movements over a specific period. Traders use different chart types, such as line charts, bar charts, and candlestick charts, to identify trends, support and resistance levels, and potential reversal points.
Key Concepts in Technical Analysis
1. Trends
Trends are the recurring price movements that show the general direction in which a currency pair is moving. There are three types of trends: uptrend, downtrend, and sideways (or horizontal) trend. Identifying the prevailing trend is crucial for traders as it helps them align their trades with the market momentum.
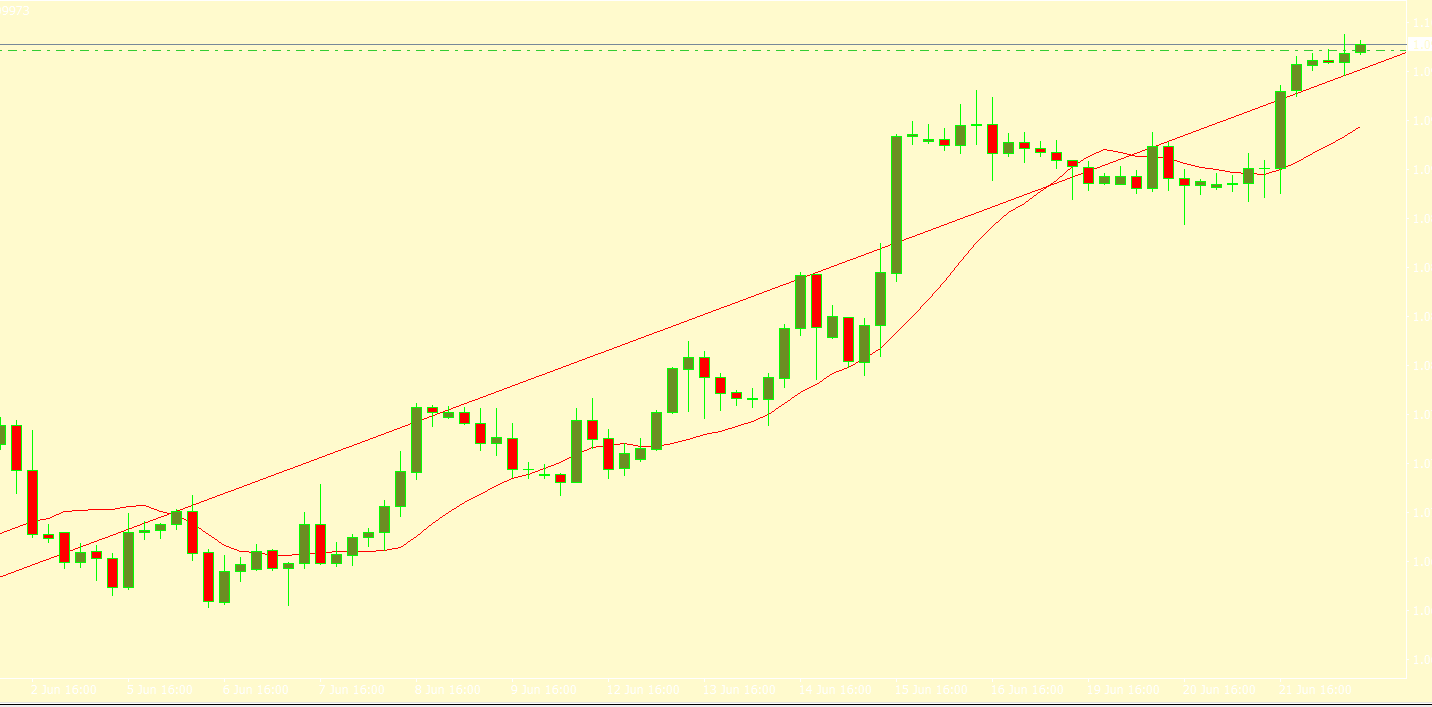
Sources from MT4
2. Support and Resistance
Support and resistance levels are price levels at which a currency pair tends to stop and reverse its direction. Support is the price level where demand is strong enough to prevent further decline, while resistance is the price level where selling pressure halts further upward movement. These levels help traders determine entry and exit points for their trades.

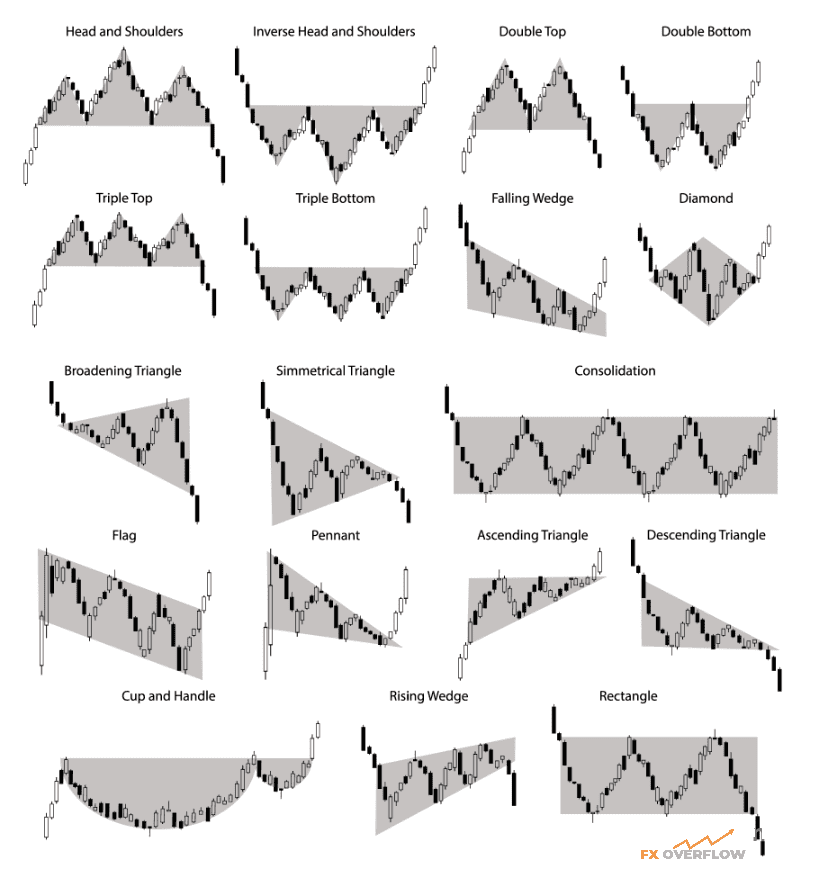
3. Chart Patterns
Chart patterns are specific formations on price charts that indicate potential trend reversals or continuations. Some common chart patterns include head and shoulders, double tops, double bottoms, and triangles. Recognizing these patterns can provide valuable insights into future price movements.
Technical Indicators
In addition to price charts and chart patterns, technical analysis employs a wide range of technical indicators. These mathematical calculations are applied to price data to help traders confirm trends, identify overbought or oversold conditions, and generate entry or exit signals.
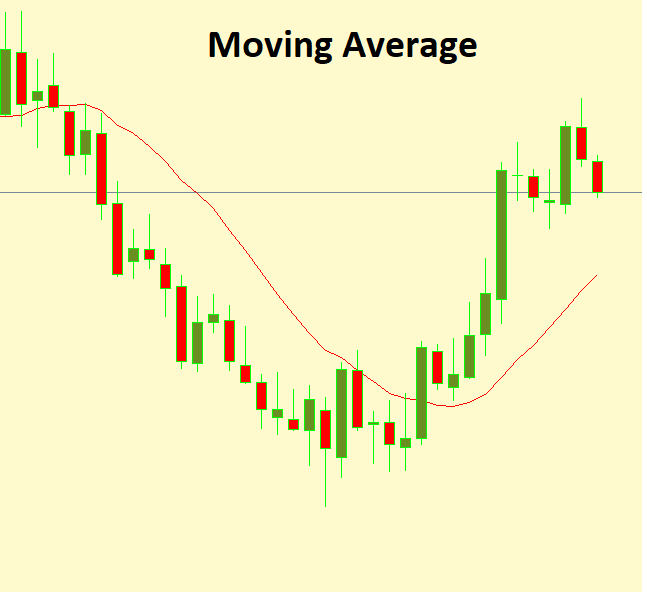
1. Moving Averages
Moving averages are trend-following indicators that smooth out price data to identify the overall trend direction. The simple moving average (SMA) and the exponential moving average (EMA) are the two most commonly used types.
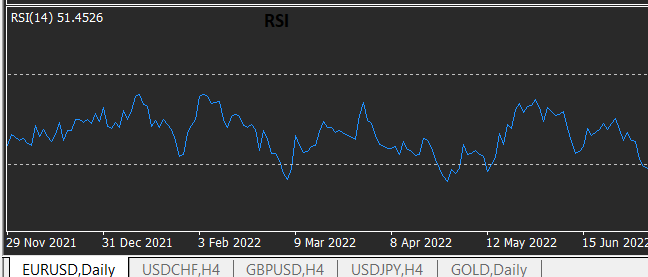
2. Relative Strength Index (RSI)
The RSI is a momentum oscillator that measures the speed and change of price movements. It ranges from 0 to 100 and is used to identify overbought or oversold conditions in a currency pair.
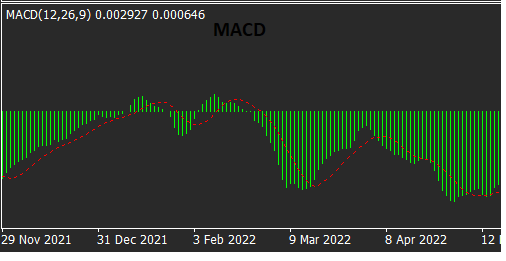
3. Moving Average Convergence Divergence (MACD)
The MACD is a versatile indicator that combines moving averages to reveal changes in a currency pair's trend strength, direction, and momentum.
How to Use Technical Analysis in Forex Trading
1. Identify the Trend
The first step in using technical analysis is to identify the prevailing trend in a currency pair. By determining whether the market is in an uptrend, downtrend, or sideways trend, traders can align their trades with the market's momentum.
2. Spotting Support and Resistance Levels
Once the trend is established, traders can look for key support and resistance levels on the price chart. These levels provide excellent entry and exit points for trades and also help set stop-loss and take-profit levels.
3. Analyzing Chart Patterns
Chart patterns offer essential clues about potential price movements. By recognizing patterns like head and shoulders or double bottoms, traders can anticipate trend reversals or continuations and adjust their trading strategies accordingly.
4. Using Technical Indicators
Integrating technical indicators into the analysis can provide additional confirmation of potential trade setups. Combining indicators like moving averages, RSI, and MACD can give traders a comprehensive view of the currency pair's current state.
The Limitations of Technical Analysis
While Forex technical analysis is a powerful tool, it's essential to acknowledge its limitations. Technical analysis is based on historical data and patterns, and it may not account for sudden market shifts caused by unexpected news events or economic developments.
Footnote
In Summary, Forex technical analysis is a valuable skill that can significantly enhance a trader's ability to predict future price movements. By understanding chart patterns, trend identification, and technical indicators, investors can make more informed decisions in the dynamic world of Forex trading. While technical analysis is an essential aspect of trading, it's vital to combine it with other forms of analysis and risk management strategies to navigate the markets successfully. Remember, practice and experience play a crucial role in mastering the art of technical analysis and becoming a successful Forex trader.


Discussion