

Forex Fibonacci Retracement: A Technical Analysis Tool Used to Identify Potential Support and Resistance Levels
In the dynamic world of financial markets, traders and investors are constantly seeking effective tools to make informed decisions. One such tool that has gained popularity among forex traders is the Fibonacci retracement. This technical analysis tool offers valuable insights into potential support and resistance levels, allowing traders to better navigate the turbulent waters of the forex market.
Table Content
1. Understanding Fibonacci Retracement
2. Applying Fibonacci Retracement in Forex Trading
3. The Psychological Aspect of Fibonacci Levels
4. Fibonacci Extensions: Projecting Future Price Targets
5. Practical Examples
6. Pros and Cons of Fibonacci Retracement
7. Footnote
Understanding Fibonacci Retracement
Fibonacci retracement is based on the mathematical sequence discovered by Leonardo of Pisa, also known as Fibonacci, during the 13th century. This sequence, known as the Fibonacci sequence, is a series of numbers in which each number is the sum of the two preceding ones: 0, 1, 1, 2, 3, 5, 8, 13, 21, and so on.
The Fibonacci retracement levels, expressed as percentages, are derived from this sequence. The most commonly used levels are 23.6%, 38.2%, 50%, 61.8%, and 78.6%. These levels are drawn on a price chart to identify potential areas of support and resistance. The concept behind this tool is that after an asset's price experiences a significant move in one direction, it is likely to retrace a portion of that move before continuing its trend.
Applying Fibonacci Retracement in Forex Trading
1. Identifying a Significant Price Move
To use Fibonacci retracement effectively, traders must first identify a significant price move on the forex chart. This move could be a substantial uptrend or downtrend, characterized by sharp price fluctuations.
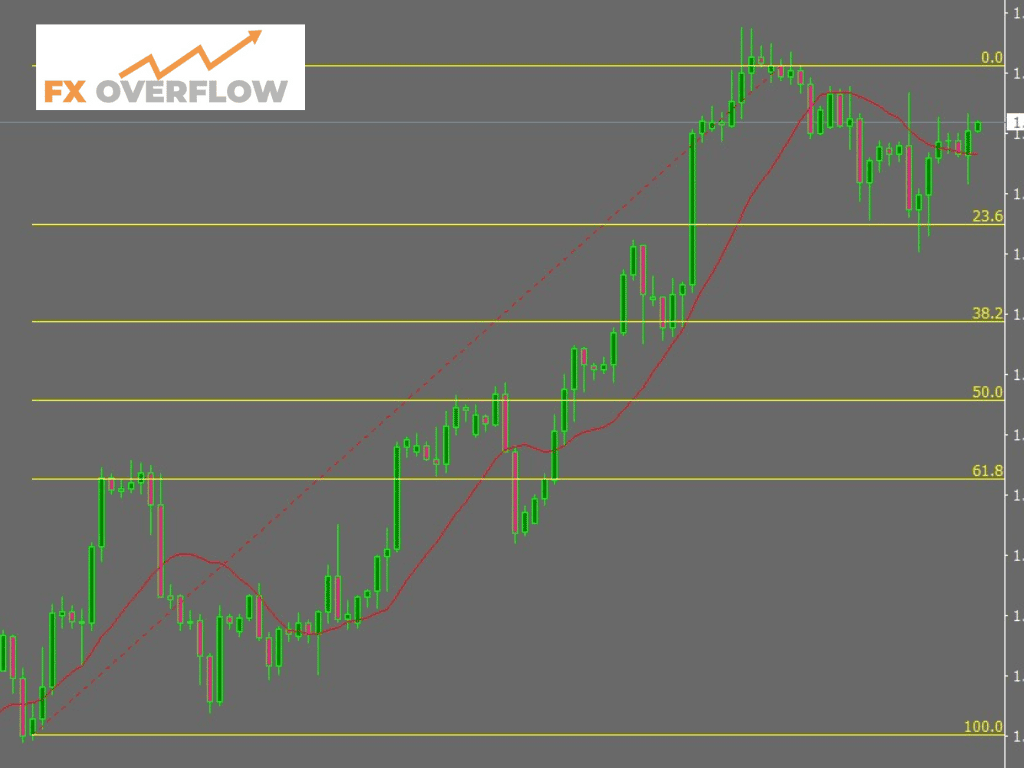
2. Drawing the Fibonacci Retracement Levels
Once the significant price move is identified, traders can draw the Fibonacci retracement levels. By connecting the high and low points of the move with a diagonal line, the tool automatically plots the key retracement levels.
3. Analyzing Support and Resistance Levels
The retracement levels act as potential support and resistance areas, where price corrections are likely to occur. Traders closely monitor these levels for potential entry and exit points for their trades. The most commonly observed retracement levels are the 38.2% and 61.8% levels.
4. Confirmation with Other Indicators
While Fibonacci retracement can be a powerful tool on its own, traders often seek additional confirmation from other technical indicators or chart patterns. Combining Fibonacci retracement with other tools can enhance the accuracy of trading signals.
The Psychological Aspect of Fibonacci Levels
Beyond the mathematical significance, Fibonacci retracement levels hold psychological importance in the minds of traders. As these levels are widely used and respected by market participants, they tend to become self-fulfilling prophecies. When many traders act upon the same levels, it can lead to increased buying or selling pressure, reinforcing the support and resistance zones identified by the Fibonacci retracement tool.
Fibonacci Extensions: Projecting Future Price Targets
In addition to retracement levels, traders also utilize Fibonacci extensions to identify potential price targets when an asset is in a strong trend. These extensions are useful in predicting the possible areas where a price move may terminate.
By measuring the distance of the initial price move and applying the Fibonacci extension levels, traders can estimate potential price targets for their trades. Common extension levels include 127.2%, 161.8%, 261.8%, and 423.6%.
Practical Examples
Example 1: Bullish Trend
Let's consider a practical example of a bullish trend in a forex pair. The price of EUR/USD has been steadily increasing, and traders expect it to continue its uptrend.
- Identify the Significant Price Move: The EUR/USD pair has experienced a strong upward move from 1.1500 to 1.2500.
- Draw the Fibonacci Retracement Levels: Connect the high point (1.2500) with the low point (1.1500) to draw the retracement levels.
- Analyze Support and Resistance Levels: The 38.2% retracement level (1.2100) and the 61.8% retracement level (1.1900) are potential support zones.
- Confirmation: Check for additional indicators, such as moving averages or trend lines, to confirm the potential entry points.
Example 2: Bearish Trend
Now, let's consider a bearish trend in the GBP/JPY pair. The price has been declining, and traders expect further downside movement.
- Identify the Significant Price Move: The GBP/JPY pair has experienced a sharp downward move from 150.00 to 130.00.
- Draw the Fibonacci Retracement Levels: Connect the high point (150.00) with the low point (130.00) to draw the retracement levels.
- Analyze Support and Resistance Levels: The 38.2% retracement level (140.00) and the 61.8% retracement level (145.00) are potential resistance zones.
- Confirmation: Use additional technical indicators, such as RSI or MACD, to confirm potential shorting opportunities.
Pros and Cons of Fibonacci Retracement
Like any other technical analysis tool, Fibonacci retracement has its own set of advantages and limitations.
Pros
- Objective and Easy to Use: The tool is objective and can be easily applied by traders of all experience levels.
- Widely Accepted: Fibonacci retracement levels are widely accepted and followed by traders, making them potentially more reliable.
- Provides Target Levels: It helps traders identify potential price targets for both entry and exit positions.
Cons
- Subjective Interpretation: Traders may disagree on the choice of the significant price move, leading to different retracement levels.
- Not Always Accurate: While Fibonacci retracement can be effective, it is not infallible and should be used in conjunction with other analysis techniques.
- Self-Fulfilling Prophecy: The popularity of these levels may lead to crowded trades and false signals.
Footnote
In Summary, forex Fibonacci retracement is a powerful technical analysis tool that aids traders in identifying potential support and resistance levels. By understanding the Fibonacci sequence and applying it to price charts, traders can gain valuable insights into market trends and possible price targets. However, it is essential to remember that no single tool guarantees success in trading. A comprehensive approach, including the use of multiple indicators and risk management strategies, is necessary for consistent profitability.


Discussion