
Forex Charts: Visual Representations of Currency Pair Price Movements Over Time
In the world of Forex trading, information is power. To make informed decisions, traders rely on a variety of tools, one of the most important being Forex charts. These visual representations of currency pair price movements over time provide valuable insights into market trends and patterns. In this article, we will explore the significance of Forex charts, the various types available, and how traders can use them effectively to enhance their trading strategies.
Table Content
1. What are Forex Charts?
2. Types of Forex Charts
3. Interpreting Forex Charts
4. Using Forex Charts in Trading Strategies
5. FAQs (Frequently Asked Questions)
6. Footnote
What are Forex Charts?
Forex charts are graphical representations of historical price data of currency pairs. They display the price movements over different time frames, ranging from minutes to months or even years. By plotting this data, traders can identify trends, patterns, and potential support and resistance levels, helping them make informed trading decisions.
Types of Forex Charts
There are several types of Forex charts, each presenting price data in a unique way. The most commonly used chart types include:
1. Line Charts
Line charts connect closing prices of a currency pair over a specific period, forming a continuous line. This chart type provides a simple overview of price trends but lacks detailed information on intraday fluctuations.
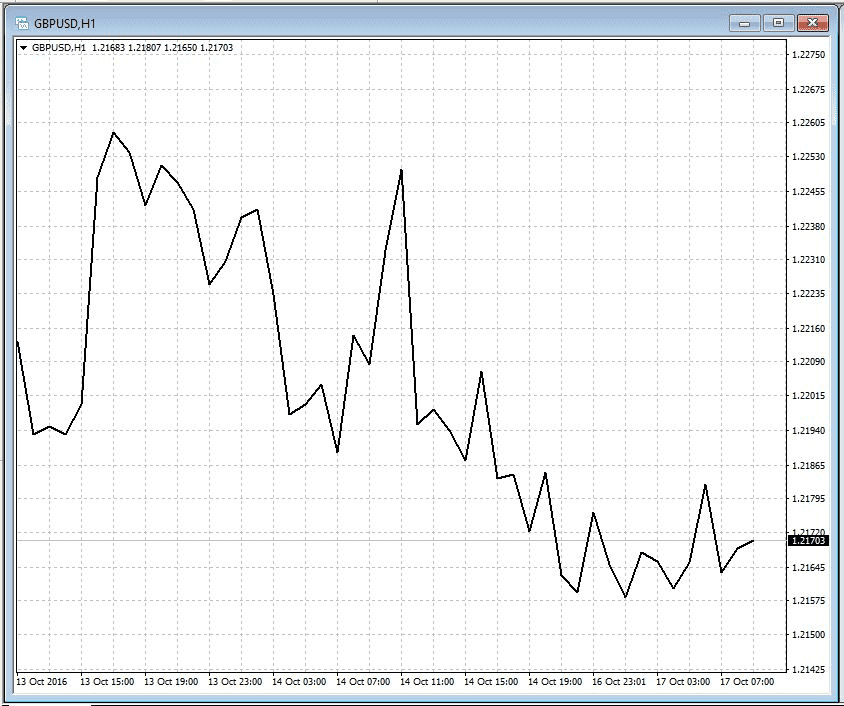
Source from MT4
2. Bar Charts
Bar charts display price information using vertical bars. Each bar represents the high, low, open, and close prices for a specific period. Traders can easily identify price ranges and the overall market sentiment.
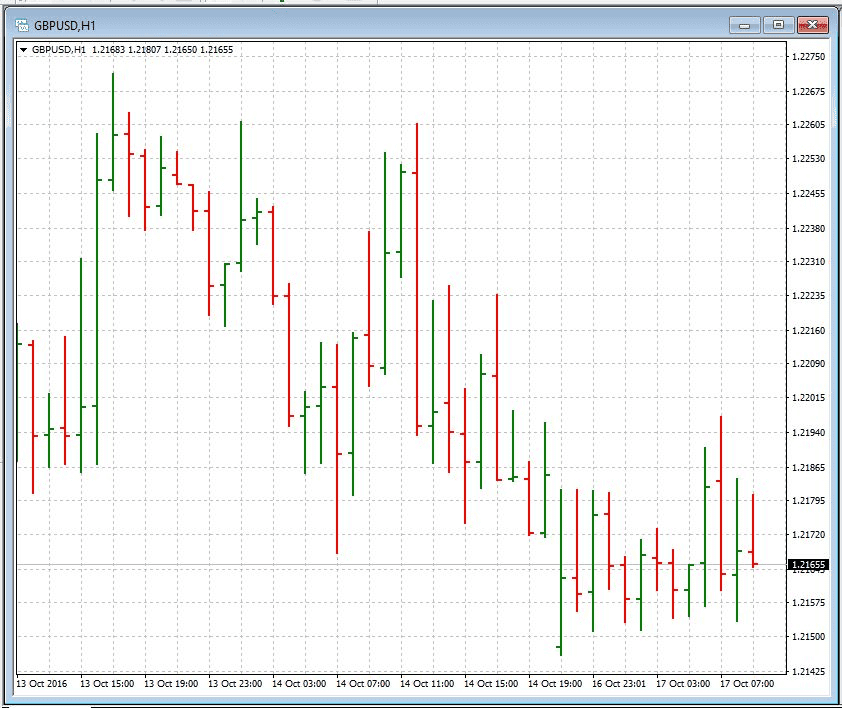
Source from MT4
3. Candlestick Charts
Candlestick charts are similar to bar charts but use candlestick shapes to represent price data. Each candlestick displays the open, high, low, and close prices for a given period. Candlestick charts offer more visual cues, making them popular among traders.
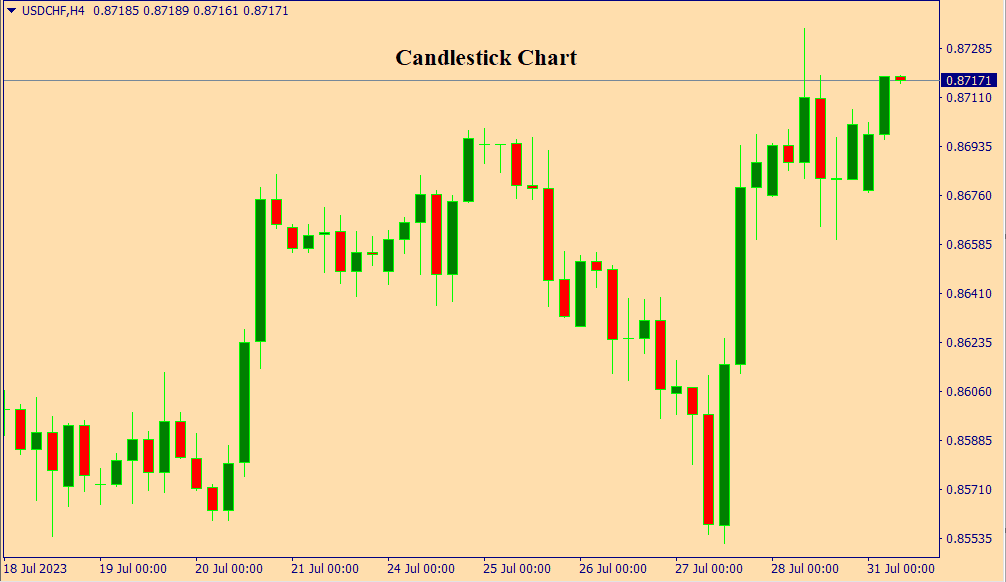
Source from MT4
4. Heikin Ashi Charts
Heikin Ashi charts are an alternative to candlestick charts, smoothing out price fluctuations for easier trend identification. They are calculated using average price data, providing a clearer view of market direction.
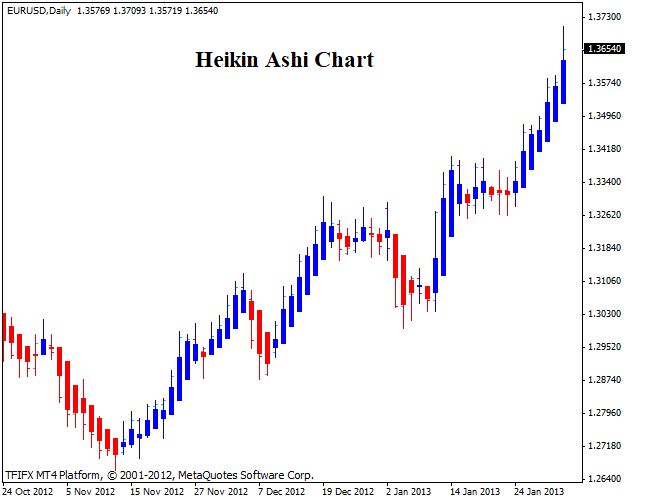
Source from MT4
5. Renko Charts
Renko charts use bricks of fixed sizes to represent price movements. Unlike time-based charts, Renko charts filter out noise and focus on significant price changes, making trends more apparent.
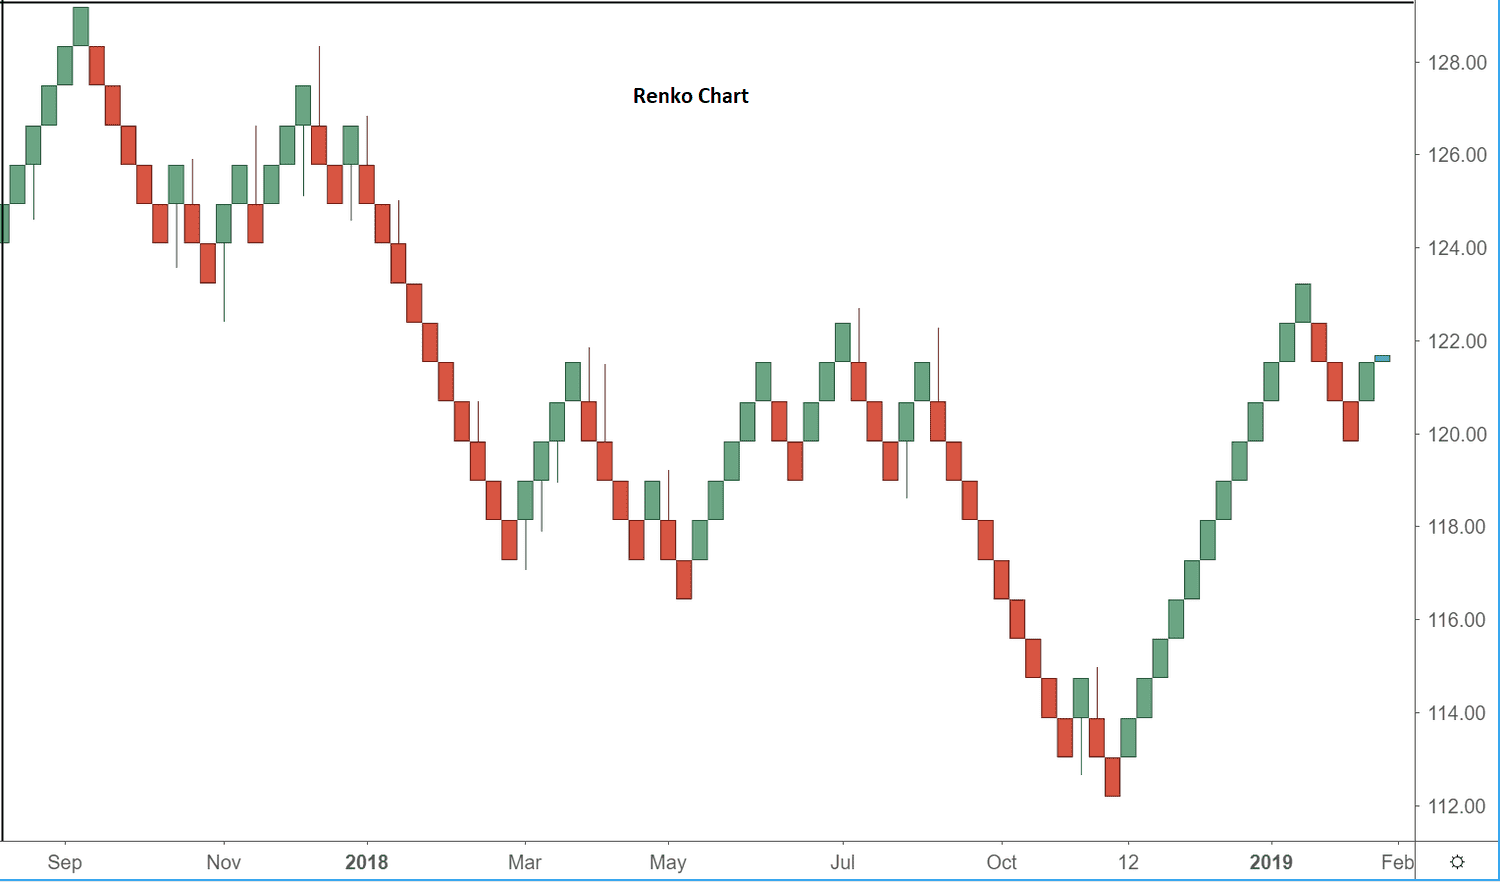
Source from MT4
6. Point and Figure Charts
Point and Figure charts use Xs and Os to represent price movements. They eliminate time-based data and focus solely on significant price changes, helping traders identify trend reversals.
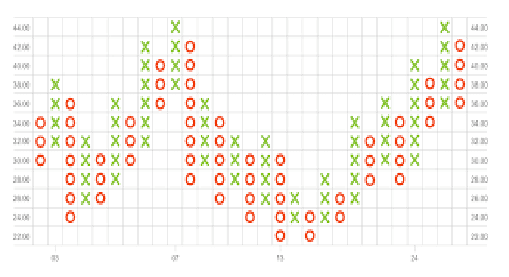
Source from MT4
Interpreting Forex Charts
Interpreting Forex charts requires an understanding of key elements:
1. Price Scale
The price scale, usually located on the right side of the chart, shows the currency pair's price levels. Traders can identify support and resistance levels by analyzing how the price interacts with these points.
2. Time Scale
The time scale, located along the bottom of the chart, represents the selected time periods. Traders can choose various time frames, such as 1-minute, 5-minute, 1-hour, or daily, depending on their trading style.
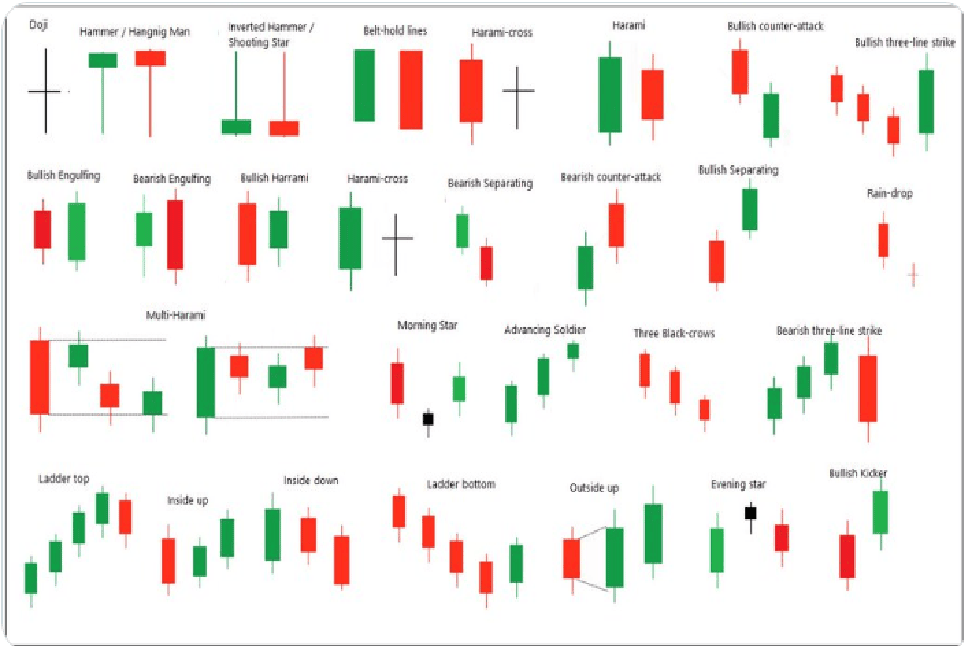
3. Candlestick Patterns
Candlestick patterns offer valuable insights into market sentiment. Patterns like Doji, Hammer, and Engulfing can indicate potential trend reversals or continuation.
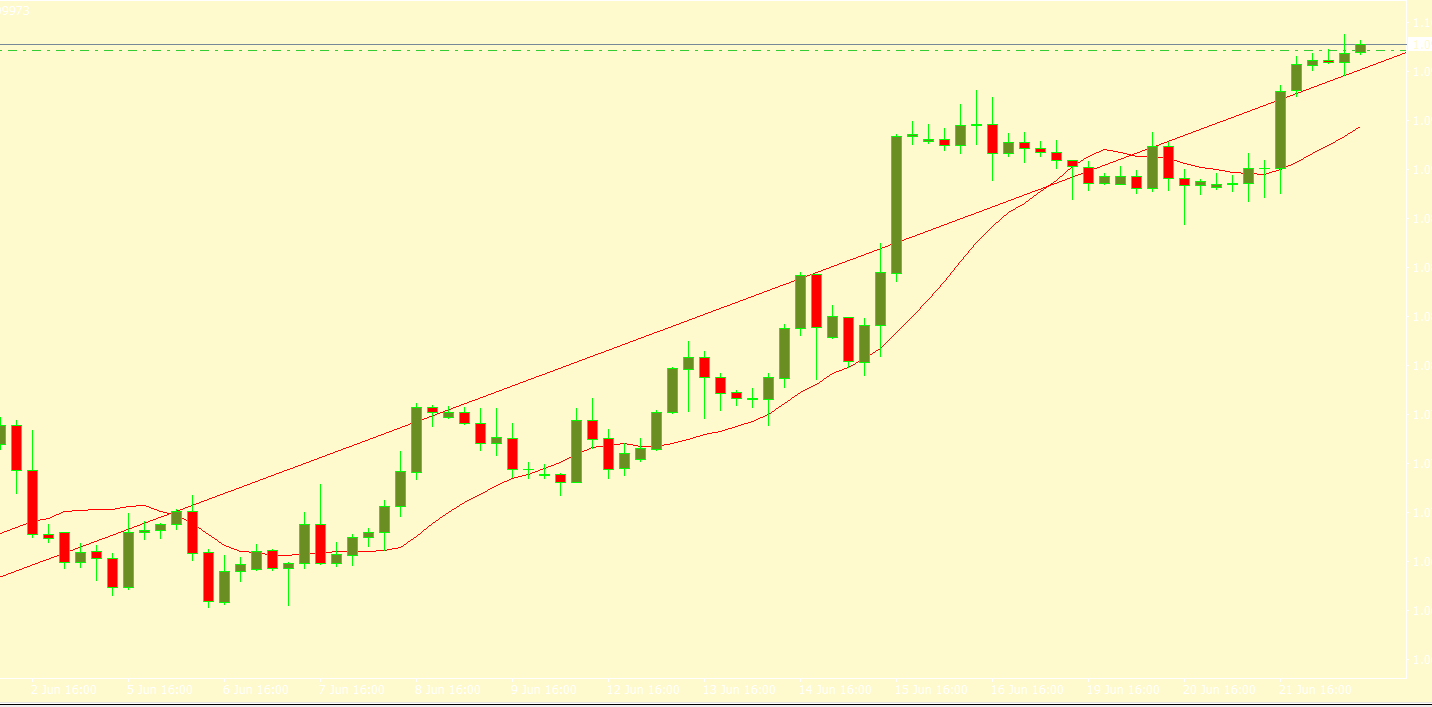
4. Trend Lines
Trend lines are drawn on charts to highlight the direction of the market. An upward-sloping trend line indicates an uptrend, while a downward-sloping trend line signifies a downtrend.
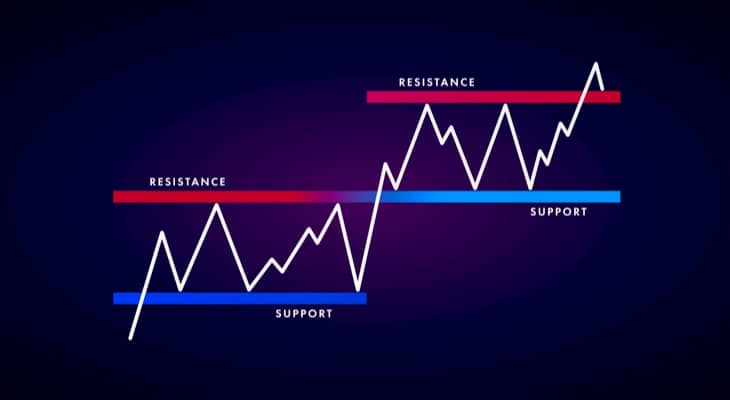
5. Support and Resistance Levels
Support levels are price levels where the currency pair tends to find buying interest, preventing further price declines. Resistance levels, on the other hand, are price levels where selling interest tends to emerge, limiting further price increases.
Using Forex Charts in Trading Strategies
Forex charts play a vital role in various trading strategies:
1. Technical Analysis
Technical analysis involves using Forex charts and technical indicators to forecast future price movements. Traders look for patterns and signals to identify potential entry and exit points.
2. Trend Following
Trend-following strategies involve identifying established trends using Forex charts and riding them until signs of reversal appear. Traders using this strategy aim to profit from sustained price movements.
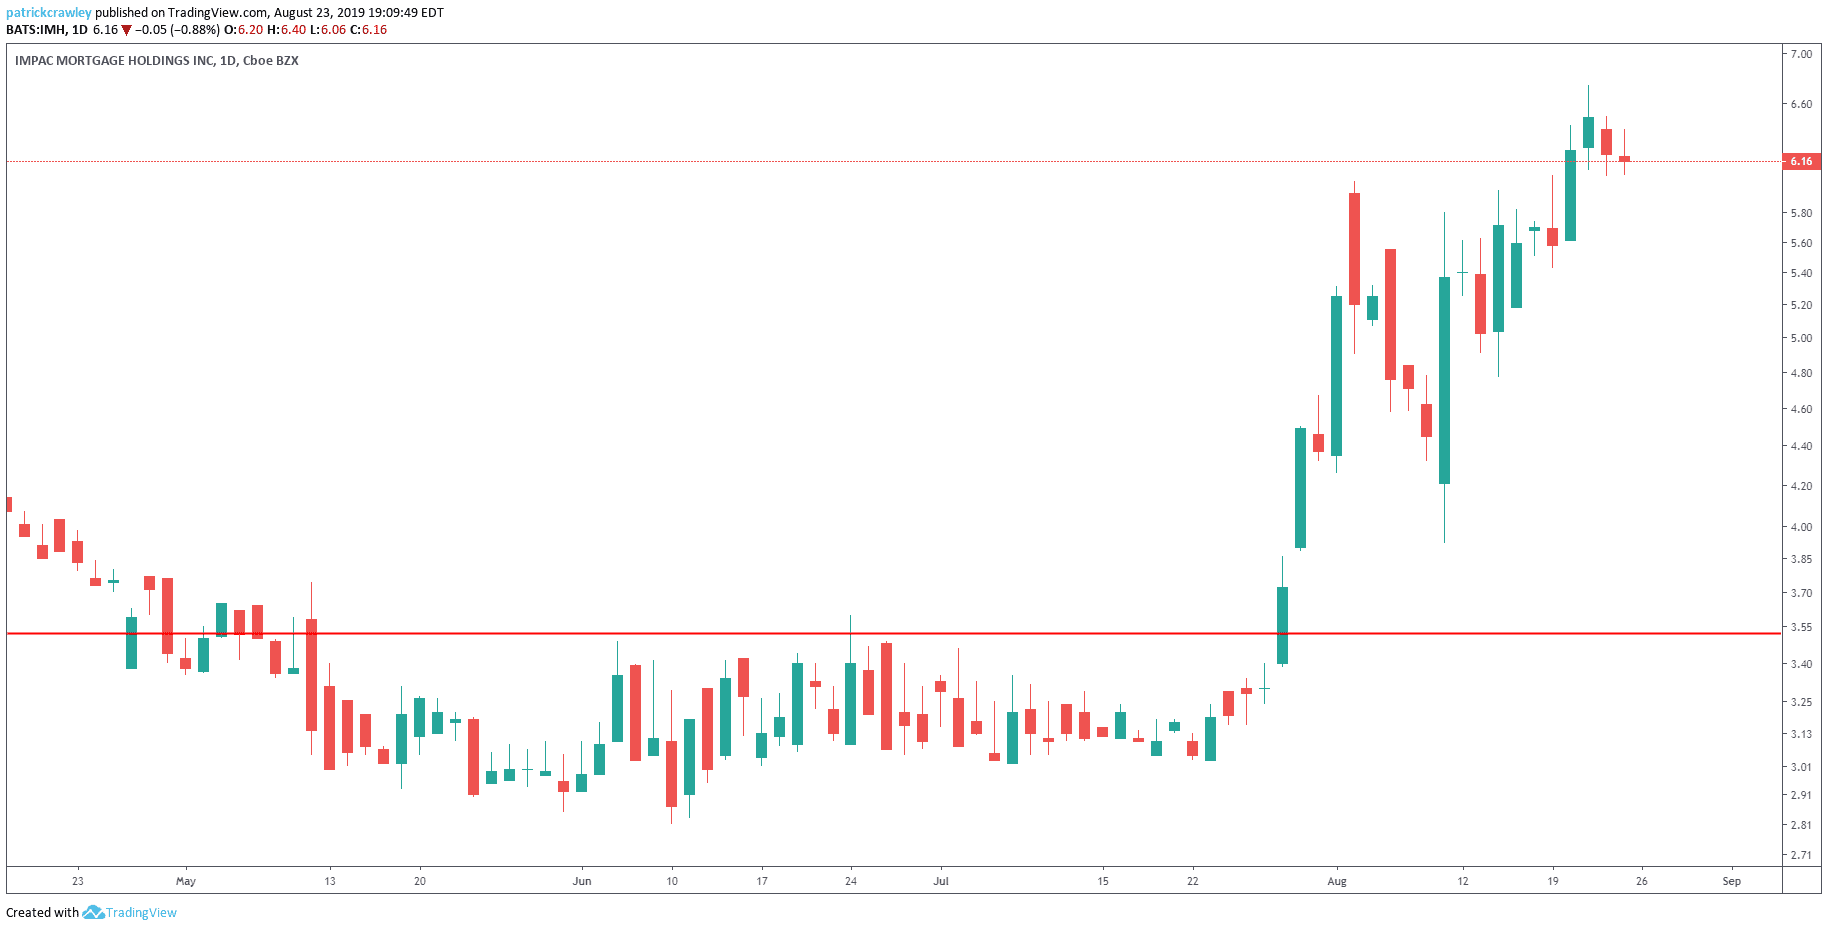
3. Breakout Trading
Breakout traders rely on Forex charts to identify key support and resistance levels. They enter positions when the price breaks out of these levels, expecting a continuation of the trend.
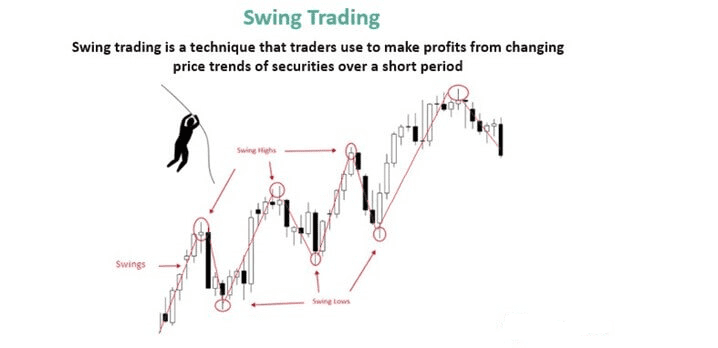
4. Swing Trading
Swing traders analyze Forex charts to identify short- to medium-term price swings. They aim to capture profits from price movements within these swings.
FAQs (Frequently Asked Questions)
- Which Forex Chart Type is the Most Popular Among Traders?
- Candlestick charts are the most popular among traders due to their visual appeal and ability to convey essential price information effectively.
- Can Forex Charts Predict Future Price Movements?
- While Forex charts provide valuable insights into historical price movements, they cannot predict future price changes with certainty. Traders should use charts in conjunction with other analysis techniques.
- How Often Should I Check Forex Charts?
- The frequency of checking Forex charts depends on your trading style. Day traders may monitor charts several times a day, while long-term traders may check them less frequently.
- Are Forex Charts Useful for Short-Term Trading?
- Yes, Forex charts are highly useful for short-term trading. Traders can identify intraday trends and make quick decisions based on chart patterns.
Footnote
Forex charts are indispensable tools for Forex traders. They provide visual representations of currency pair price movements over time, enabling traders to identify trends, patterns, and potential trading opportunities. Whether you are a short-term day trader or a long-term position trader, understanding how to interpret Forex charts can significantly enhance your trading strategies. Remember, while charts offer valuable insights, successful trading requires a comprehensive approach that includes other analytical tools and risk management practices.


Discussion