
Forex candlestick patterns: Visual patterns on price charts indicating potential market movements.
In the world of financial markets, understanding price charts is crucial for successful trading. Candlestick patterns are one of the most powerful tools that traders use to analyze and predict market movements. These visual patterns provide valuable insights into market psychology and help traders make informed decisions.
In this comprehensive guide, we will delve deep into Forex candlestick patterns. From basic concepts to advanced techniques, we will cover everything you need to know about using candlestick patterns effectively in your trading strategies. So, let's light up the path to a better understanding of these visual indicators and uncover the potential market movements they reveal.
Table content
1. Forex Candlestick Patterns: The Basics
2. Identifying Continuation Patterns
3. Detecting Reversal Patterns
4. Exploring Combination Patterns
5. Incorporating Advanced Patterns
6. Maximizing Profits with Candlestick Patterns
7. FAQs
8. Footnote
Forex Candlestick Patterns: The Basics
Forex candlestick patterns are graphical representations of price movements over a specific period. They are formed by plotting the open, high, low, and close prices of an asset on a chart. Each candlestick represents a single period, such as a day, hour, or minute. Traders use these patterns to identify trends, reversals, and potential market turning points.
A. Bullish Candlestick Patterns
Bullish candlestick patterns signal potential upward price movements. They indicate that buyers are in control, and the market sentiment is optimistic.

- Hammer: The hammer pattern has a small body and a long lower shadow, resembling a hammer. It suggests a potential bullish reversal after a downtrend.
- Bullish Engulfing: This pattern occurs when a larger bullish candle completely engulfs the previous bearish candle, indicating a shift in momentum.
B. Bearish Candlestick Patterns
Bearish candlestick patterns suggest potential downward price movements. They indicate that sellers are dominant, and the market sentiment is bearish.
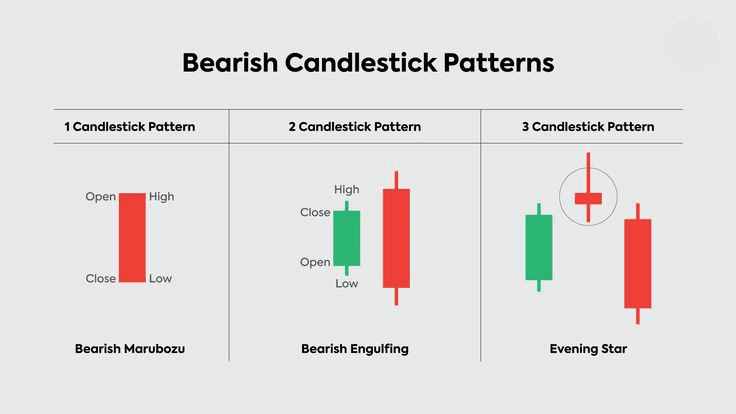
- Evening Star: The Evening star pattern has a small body and a long upper shadow, signaling a potential bearish reversal after an uptrend.
- Bearish Engulfing: This pattern happens when a larger bearish candle engulfs the previous bullish candle, signaling a shift in momentum to the downside.
C. Doji Candlestick Patterns
Doji candlestick patterns have almost equal open and close prices, resulting in a small or nonexistent body. They suggest indecision in the market and often precede significant price movements.
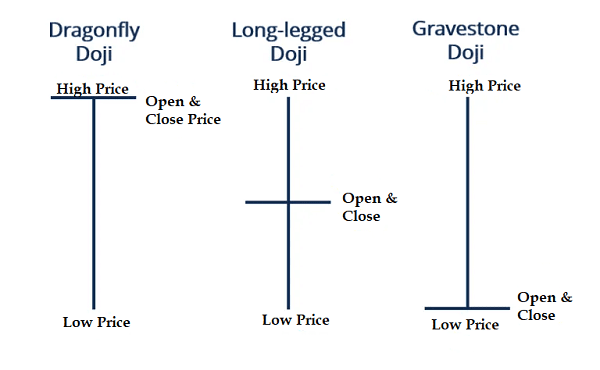
- Neutral Doji: The neutral doji has a small body and indicates market uncertainty, neither bullish nor bearish.
- Long-Legged Doji: This pattern has long upper and lower shadows, representing increased indecision among traders.
Identifying Continuation Patterns
Continuation patterns suggest that the prevailing trend is likely to continue after a temporary pause. Traders can capitalize on these patterns to stay with the trend and maximize their profits.
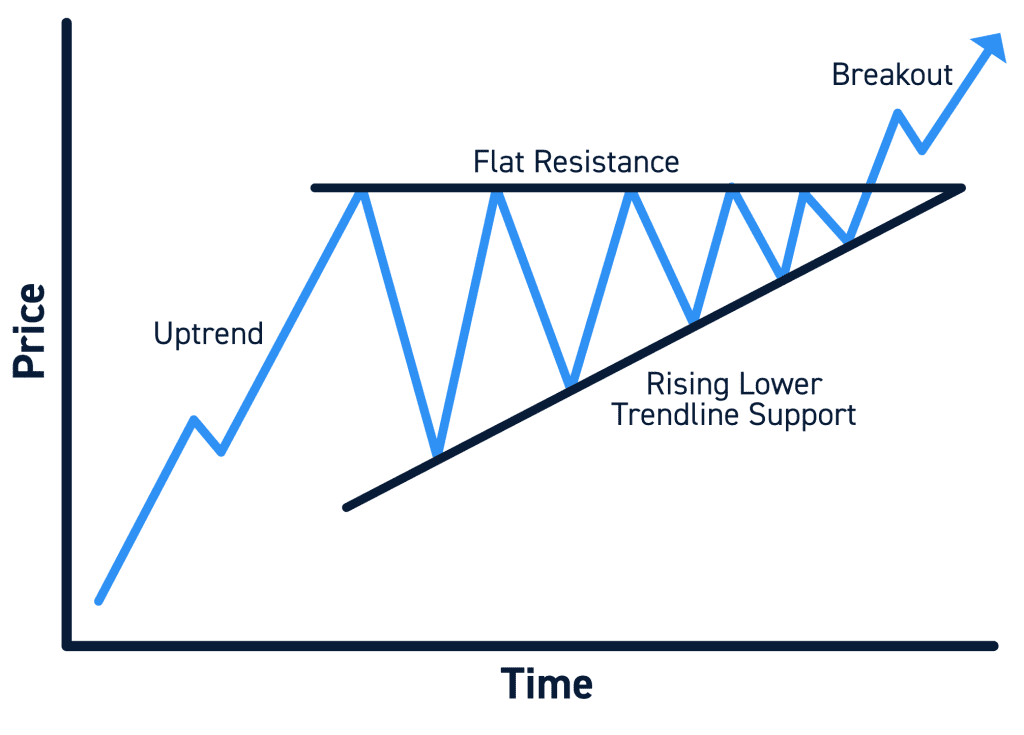
· Ascending Triangle
The ascending triangle pattern features a horizontal resistance line and an upward-sloping support line. It signals a bullish continuation, indicating that the price is likely to break out to the upside.
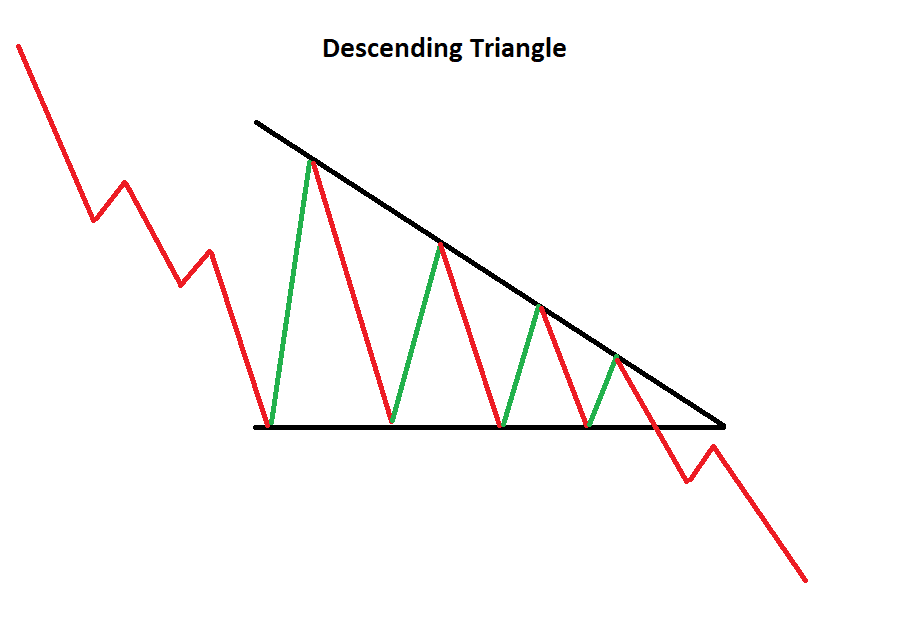
· Descending Triangle
The descending triangle pattern has a horizontal support line and a downward-sloping resistance line. It suggests a bearish continuation, indicating an imminent downward price breakout.
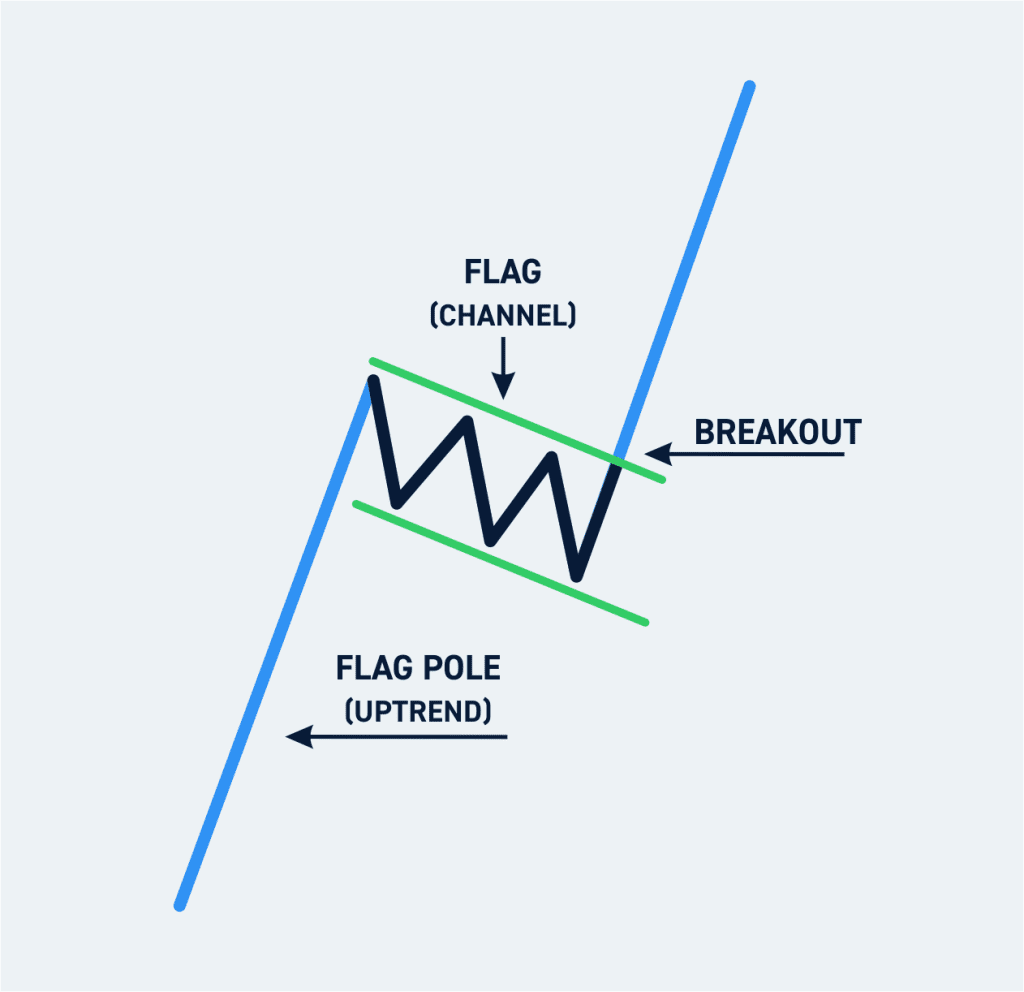
· Bull Flag
The bull flag pattern consists of a sharp upward price movement (the flagpole) followed by a consolidation (the flag). It suggests a continuation of the bullish trend.
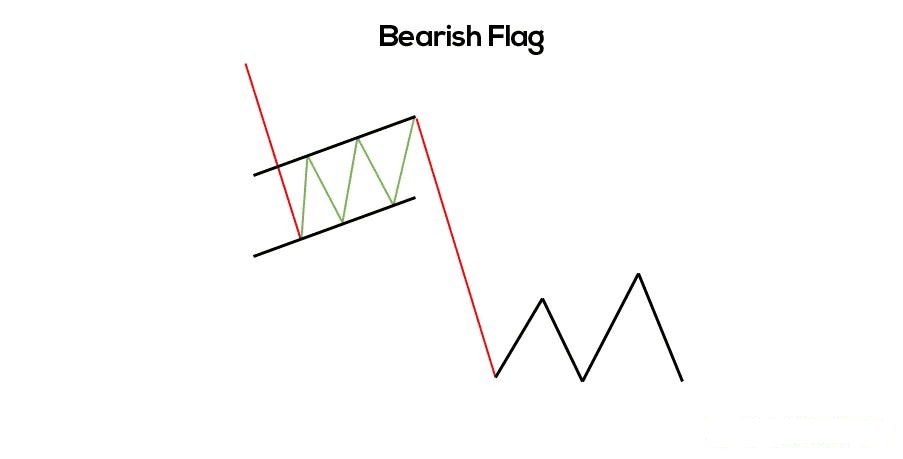
· Bear Flag
The bear flag pattern is the opposite of the bull flag, featuring a sharp downward price movement followed by a consolidation. It signals a continuation of the bearish trend.
Detecting Reversal Patterns
Reversal patterns indicate potential trend reversals, allowing traders to enter the market at the early stages of a new trend and capitalize on significant price movements.
· Head and Shoulders
The head and shoulders pattern consists of three peaks, with the central peak (the head) higher than the two shoulders. It signals a bullish-to-bearish trend reversal.
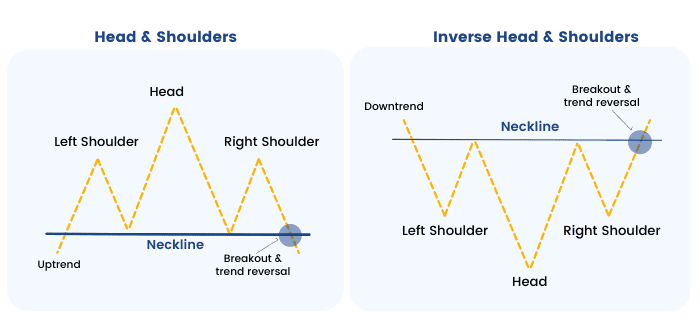
· Inverse Head and Shoulders
The inverse head and shoulders pattern is the opposite of the head and shoulders, signaling a bearish-to-bullish trend reversal.
· Double Top
The double top pattern features two peaks of similar height, signaling a potential bearish reversal.
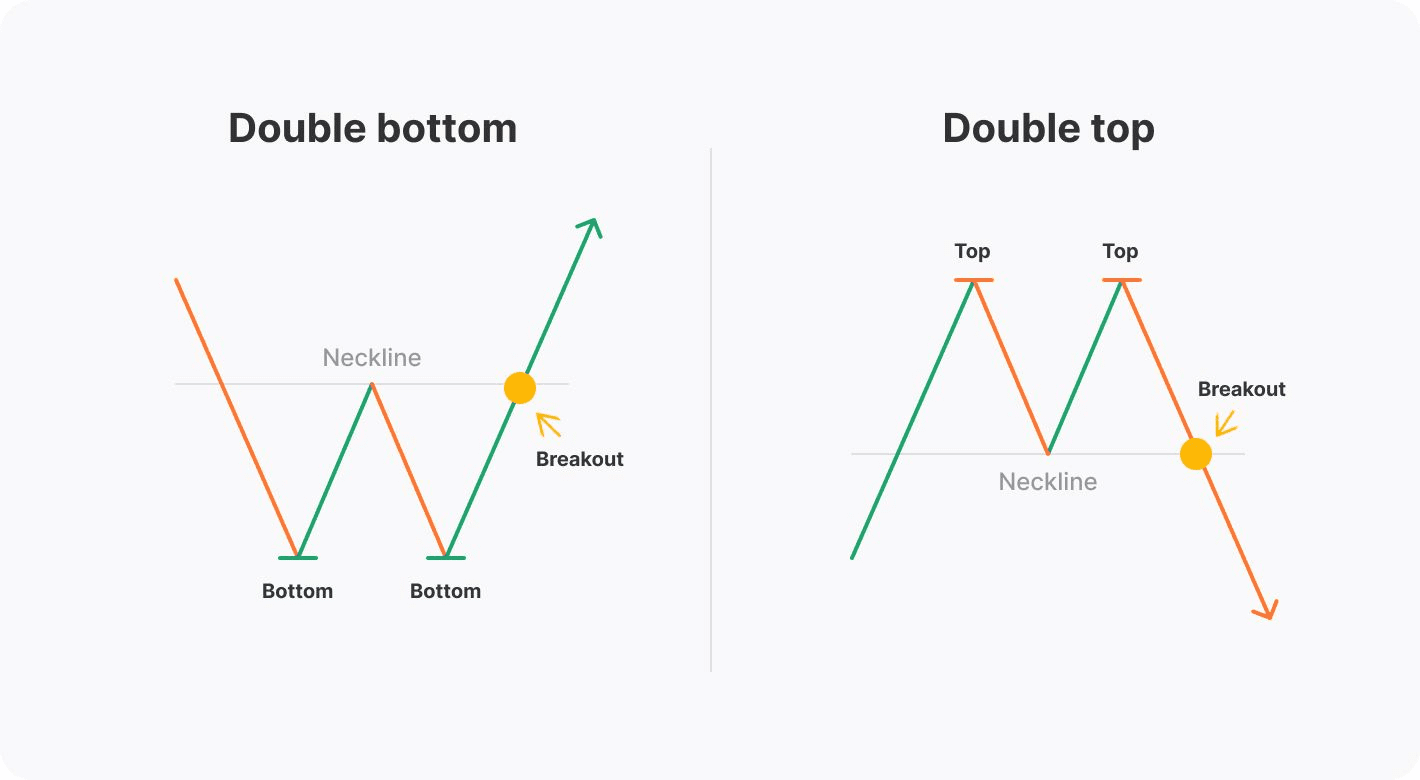
· Double Bottom
The double bottom pattern has two troughs of similar depth, indicating a potential bullish reversal.
· Triple Top
The triple top pattern has three similar peaks, suggesting a potential bearish reversal.
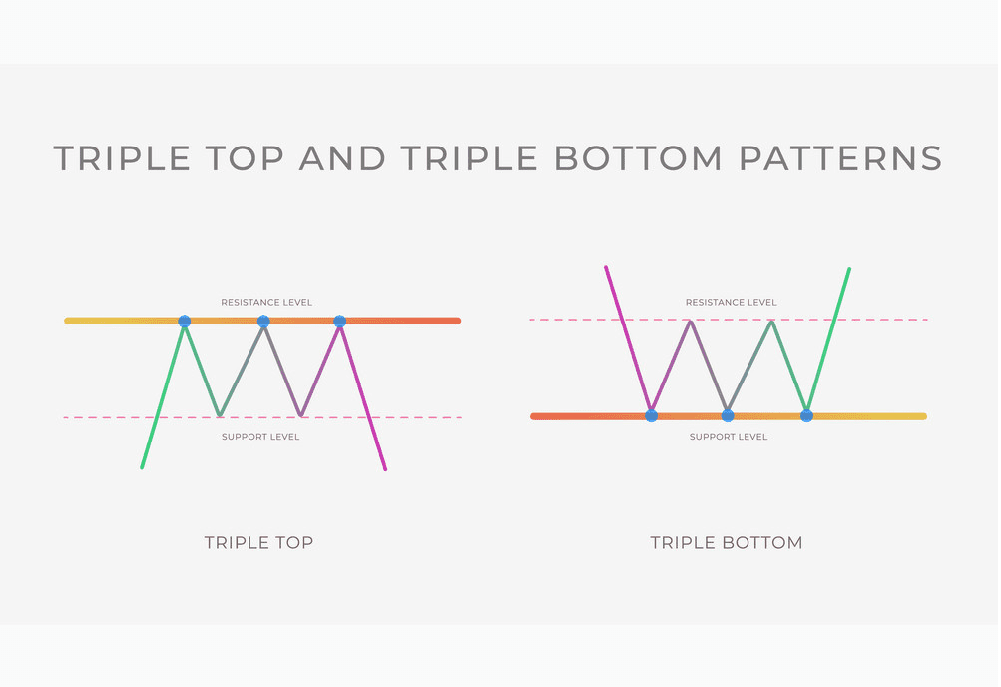
· Triple Bottom
The triple bottom pattern has three similar troughs, indicating a potential bullish reversal.
Exploring Combination Patterns
Combination patterns are more complex formations that combine elements of multiple basic patterns, providing deeper insights into market dynamics.
· Bullish Piercing Pattern
The bullish piercing pattern occurs when a bullish candle closes more than halfway above the previous bearish candle. It suggests a potential bullish reversal.
· Evening Star
The evening star pattern is a three-candle formation. It begins with a large bullish candle, followed by a small body, and ends with a large bearish candle. It signals a potential bearish reversal.
· Morning Star
The morning star pattern is the opposite of the evening star, signaling a potential bullish reversal.
· Harami Cross
The harami cross pattern consists of a small doji candle within the body of a larger candle. It indicates a potential trend reversal.
Incorporating Advanced Patterns
Advanced candlestick patterns provide deeper insights into market sentiment and are typically used by experienced traders.
· Tweezer Tops
The tweezer tops pattern occurs when two consecutive candles have identical highs, signaling a potential bearish reversal.
· Tweezer Bottoms
The tweezer bottoms pattern is the opposite of tweezer tops, signaling a potential bullish reversal.
· Three White Soldiers
The three white soldiers pattern features three consecutive long bullish candles, indicating a strong uptrend.
· Three Black Crows
The three black crows pattern is the opposite of three white soldiers, signaling a strong downtrend.
Maximizing Profits with Candlestick Patterns
Now that you've familiarized yourself with various candlestick patterns, it's essential to understand how to use them effectively in your trading strategy.
· Risk Management
Always implement proper risk management techniques to protect your capital from potential losses.
· Combining Candlestick Patterns with Technical Indicators
Enhance your analysis by combining candlestick patterns with technical indicators, such as moving averages and oscillators.
· Backtesting Strategies
Before applying candlestick patterns in live trading, backtest your strategies using historical data to gauge their effectiveness.
· Continuous Learning and Adaptation
Financial markets are dynamic, and new candlestick patterns may emerge. Stay updated, keep learning, and adapt your trading strategies accordingly.
FAQs
Q: What is the most reliable candlestick pattern for predicting a trend reversal?
The head and shoulders pattern is widely considered one of the most reliable candlestick patterns for predicting trend reversals.
Q: Can candlestick patterns be used for short-term trading?
Yes, candlestick patterns can be effectively used for short-term trading, such as day trading or scalping.
Q: Are candlestick patterns applicable to all financial markets?
Yes, candlestick patterns are applicable to various financial markets, including stocks, forex, commodities, and cryptocurrencies.
Q: How can I learn more about candlestick patterns?
There are numerous online resources, books, and courses available that provide in-depth knowledge and insights into candlestick patterns.
Q: Should I rely solely on candlestick patterns for trading decisions?
While candlestick patterns are powerful tools, it's essential to use them in conjunction with other technical and fundamental analysis tools for well-rounded trading decisions.
Q: Can I automate my trading strategy based on candlestick patterns?
Yes, many trading platforms allow you to automate your trading strategies based on specific candlestick patterns using algorithmic trading tools.
Footnote
In Summary, forex candlestick patterns are a priceless asset for any trader seeking to gain a competitive edge in the financial markets. By understanding these visual patterns and incorporating them into your trading strategy, you can make more informed decisions and potentially increase your profitability.
Remember to practice and backtest your strategies thoroughly before implementing them in live trading. Stay curious, keep learning, and adapt to changing market conditions. With dedication and patience, you can master the art of reading candlestick patterns and unlock the potential to thrive in the dynamic world of trading.


Discussion